Overview
Summary
The useful answer before the supporting detail.
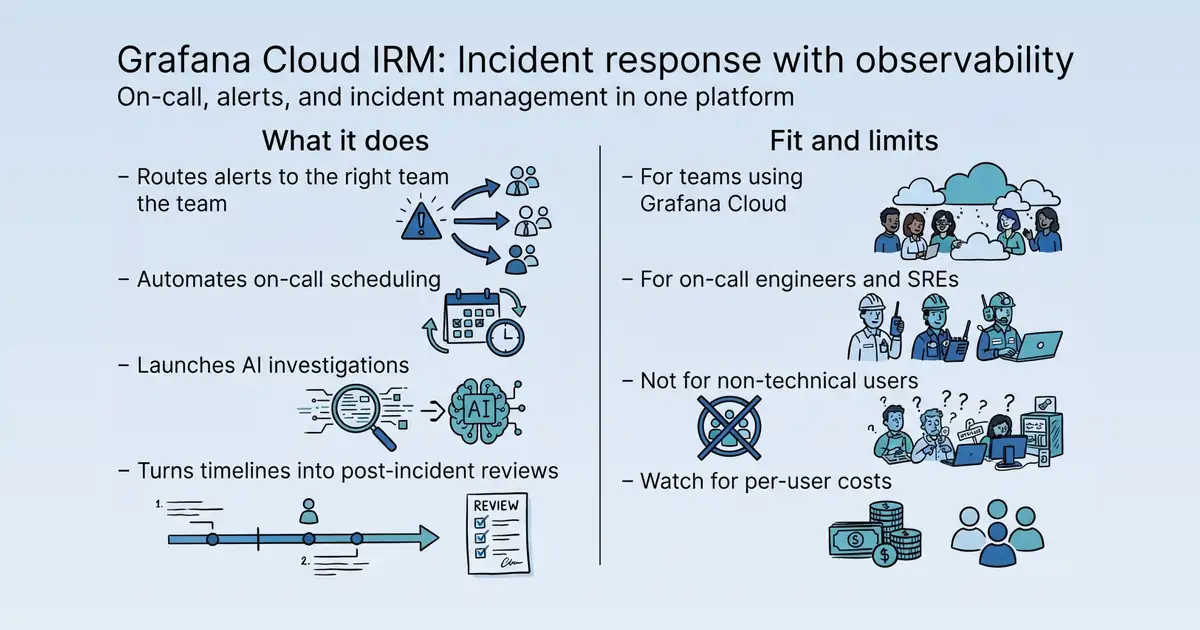
Grafana Cloud IRM is an incident response and management product that integrates on-call, alert routing, and incident management with observability data S1. It is used by engineering teams to resolve issues faster by connecting alerts to context and automating workflows S1. Its practical value lies in reducing mean time to resolution through AI investigations, structured post-incident reviews, and multi-channel notifications S1.
Product identity and positioning
Name, category, positioning, audience, and first-party claims.
- Identity: Grafana Cloud IRM, an incident response and management product by Grafana Labs S1.
- Core purpose: Brings on-call, alert routing, and incident management into the context of observability data to resolve issues faster S1.
- Intended users: Engineering and operations teams using Grafana Cloud S1.
- Product scope: A component of Grafana Cloud, combining on-call scheduling, alert management, incident coordination, and post-incident reviews S1.
- Positioning: On-call and incident response built into your Grafana Cloud stack S1.
- Claimed distinction: Post-incident review starts from recorded facts, not memory S1.
Use cases and audiences
Who the product serves and the jobs it is designed to handle.
| Audience | Practical use case |
|---|---|
| On-call engineers | Receive alerts via mobile, Slack, or phone and resolve or escalate incidents without switching tools S1. |
| Incident responders | Coordinate response with automatic notifications and AI analysis of telemetry S1. |
| Engineering managers | Track incident timelines and generate structured post-incident reviews from recorded facts S1. |
| SRE teams | Manage on-call rotations and alert routing to reduce alert fatigue S1. |
Traffic and search
SEO analysis
Collected Oct 20, 2026grafana.com: an estimated 1,149,327 total monthly visits and about 83,891 monthly organic visits across 27,017 ranking keywords. Scout crawled 15 pages and measured a technical health score of 90/100.
Search summary
The useful answer before the supporting detail.
Avoid lock-in and ensure reliability with Grafana Cloud. The AI-powered platform built on open standards unifies metrics, logs, traces, profiles, and business data. grafana.com: an estimated 1,149,327 total monthly visits and about 83,891 monthly organic visits across 27,017 ranking keywords. Scout crawled 15 pages and measured a technical health score of 90/100.
- Total traffic (modeled): 1,149,327 monthly visits across all channels.
- Organic search traffic (estimated): 83,891 monthly visits from search.
- Strongest sampled ranking: alert notification template at position 1.
- Leading page in the collected evidence: https://grafana.com/docs/grafana/latest/alerting/configure-notifications/template-notifications/manage-notification-templates/.
- Closest measured organic competitor: logicmonitor.com, appearing 1 times in the sampled first-page SERPs.
- Technical crawl: 15 pages, health score 90/100.
Website intelligence — Collected evidence
Company identity and positioning
| Page type | Evidence | Source |
|---|---|---|
| other | Avoid lock-in and ensure reliability with Grafana Cloud. The AI-powered platform built on open standards unifies metrics, logs, traces, profiles, and business data. | https://grafana.com/ |
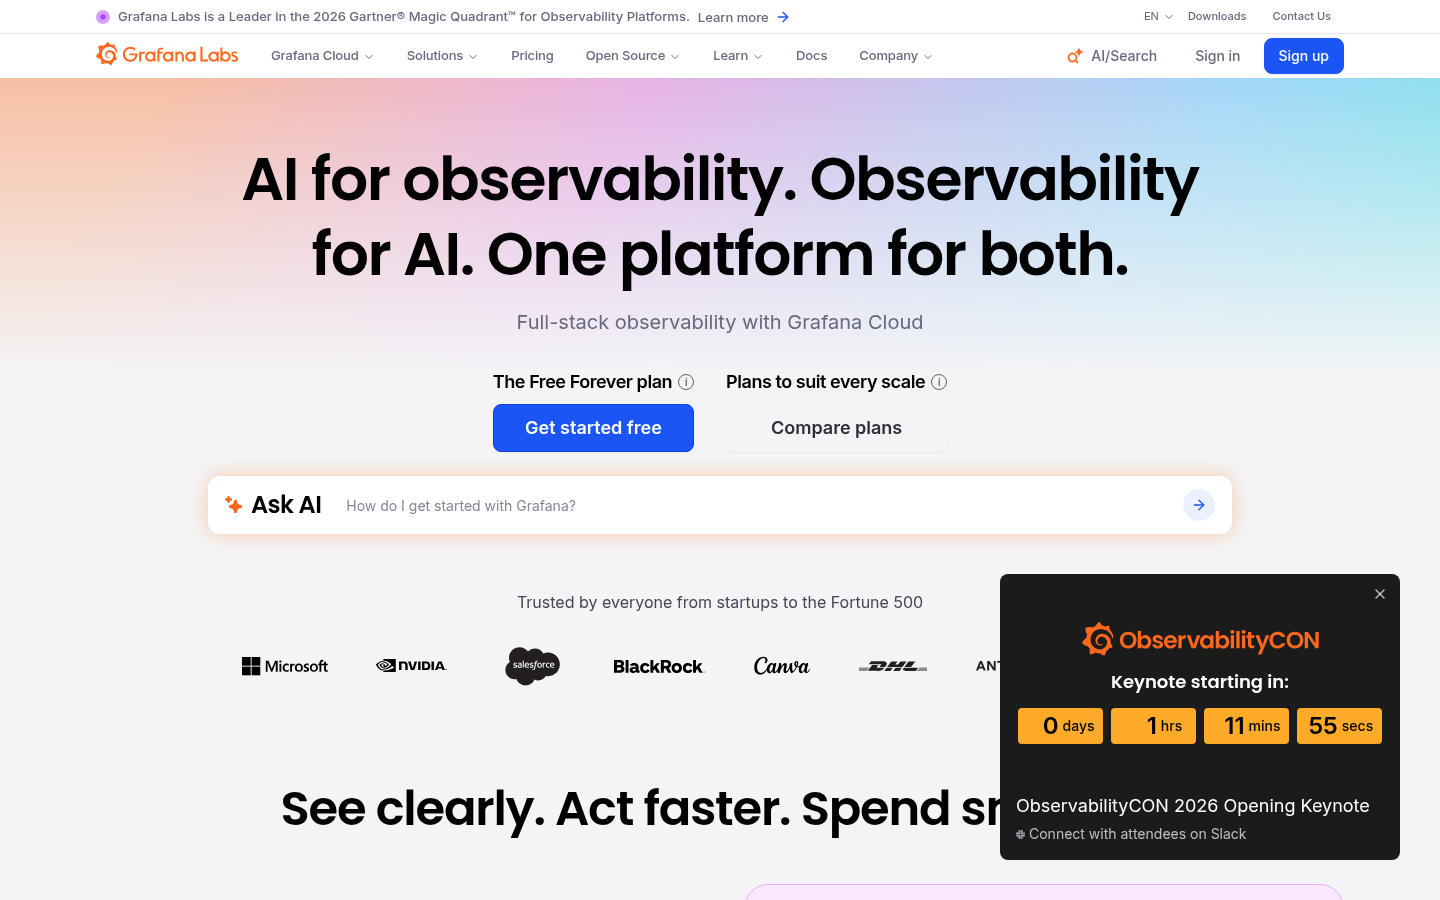
| other | Grafana Labs is a Leader in the 2026 Gartner® Magic Quadrant™ for Observability Platforms. | https://grafana.com/ |
| other | AI for observability. Observability for AI. One platform for both. | https://grafana.com/ |
| other | [](#ai-for-modern-operations)AI for modern operations | https://grafana.com/ |
| other | Use Grafana Assistant to understand production telemetry, Investigations to accelerate root cause analysis, and Agent Observability to evaluate and improve production AI agents. All in one OpenTelemetry-native platform. | https://grafana.com/ |
| other | [](#cut-costs-only-pay-for-the-data-that-matters)Cut costs. Only pay for the data that matters. | https://grafana.com/ |
| other | Too many tools and data silos? Grafana Cloud unifies telemetry signals into one clear map so your teams can move faster and operate with confidence. | https://grafana.com/ |
| other | Connect your existing tools and data sources to Grafana Cloud — no rip-and-replace required. Built on open standards like OpenTelemetry and Prometheus, with hundreds of plugins and integrations ready to extend your stack. | https://grafana.com/ |
| other | Our open observability cloud includes incident response, testing, synthetic monitoring, and more, built on open standards and usable by individual teams or across an organization. | https://grafana.com/ |
| other | ](/products/cloud/ai-tools-for-observability/?pg=hp&plcmt=marketecture-ai-powered-observability)[ | https://grafana.com/ |
| other | [](#leader-in-the-2026-gartner-magic-quadrant-for-observability-)Leader in the 2026 Gartner® Magic Quadrant™ for Observability Platforms | https://grafana.com/ |
| other | [](#ai-week-recap-see-whats-next-for-ai-in-production)AI Week recap: See what's next for AI in production | https://grafana.com/ |
Domain performance
Modeled total traffic, six-month trend, engagement, countries, and domain identity.
Total website traffic
| Month | Modeled visits |
|---|---|
| 2026-04 | 1,501,823 |
| 2026-05 | 1,373,252 |
| 2026-06 | 1,344,035 |
| 2026-07 | 1,270,993 |
| 2026-08 | 1,148,440 |
| 2026-09 | 1,149,327 |
Top visitor countries
| Country | Name | Traffic share |
|---|---|---|
| US | United States | 17.9% |
| IN | India | 6.8% |
| GB | United Kingdom | 6.3% |
| DE | Germany | 6.2% |
| CN | China | 4.9% |
Domain identity
| Signal | Value |
|---|---|
| Registered | May 27, 2014 |
| Last changed | May 26, 2026 |
| Expires | May 27, 2027 |
| WHOIS server | whois.verisign-grs.com |
| DNSSEC | Not signed |
| Nameservers | NS-1007.AWSDNS-61.NET, NS-1528.AWSDNS-63.ORG, NS-153.AWSDNS-19.COM, NS-1625.AWSDNS-11.CO.UK |
Website capture
Organic keywords
Top keywords and an independent Google result page.
Top organic keywords
| Keyword | Volume | CPC | Estimated value |
|---|---|---|---|
| grafana | 195,430 | $0.73 | $91,340 |
| grafana dashboard | 14,030 | $2.36 | $9,620 |
| grafana labs | 9,840 | $1.31 | $8,580 |
| grafana cloud | 8,280 | $7.97 | $7,720 |
| grafana mcp | 6,650 | $3.19 | $6,810 |
Independent Google result page
Query: alert notification template
| Position | Title | URL | Description |
|---|---|---|---|
| 1 | Template notifications | Grafana documentation | https://grafana.com/docs/grafana/latest/alerting/configure-notifications/template-notifications/ | Go to Alerting -> Contact points. Click the Notification Templates tab then, click the + New notification template button. Name your template. In the ... |
| 2 | Managing Alert Message Template | https://www.logicmonitor.com/support/managing-alert-message-template | The alert message template setting allows you to edit the template for email, SMS, and voice and provide alert details to the user. |
| 3 | Get started with Grafana Alerting: Template your alert notifications | https://www.youtube.com/watch?v=9CSrQGKeZwQ | In this tutorial you will learn how to template your alerts. help you get the most out of alerting in Grafana. Template your alert ... |
| 4 | Notification template reference | https://prometheus.io/docs/alerting/latest/notifications/ | Prometheus creates and sends alerts to the Alertmanager which then sends notifications out to different receivers based on their labels. |
| 5 | Free and customizable notification templates | https://www.canva.com/templates/s/notification/ | Explore professionally designed notification templates you can customize and share easily from Canva. |
| 6 | 7 Emergency Notification Message Templates | https://www.singlewire.com/blog/message-templates | While every organization is different, we've compiled 7 common scenarios for organizations, and corresponding templates for mass messaging. |
| 7 | 6 Emergency Preparedness Alerting Templates ... | https://www.alertus.com/blog/6-alerting-templates-emergency-preparedness | With these six easy-to-use emergency preparedness templates, you can customize your message text with specific instructions and choose who ... |
| 8 | Create notification templates - Amazon Managed Grafana | https://docs.aws.amazon.com/grafana/latest/userguide/v9-alerting-create-templates.html | Create reusable notification templates to send to your contact points. You can add one or more templates to your notification template. |
| 9 | Templates | https://www.fema.gov/emergency-managers/practitioners/integrated-public-alert-warning-system/public-safety-officials/toolkit/templates | Utilize this template tool below to craft 90- and 360-character messages to save time during a disaster or emergency. Alert originators must continue to send 90 ... |
Important pages
Pages earning the most estimated search traffic in the sample.
Website intelligence — Collected evidence
Prioritized website intelligence pages
| Type | Page | Words | Change | URL |
|---|---|---|---|---|
| other | Full-stack observability for the agentic era \ | static | 880 | new |
| pricing | Grafana Pricing \ | Grafana Labs | playwright | 2,765 |
| integrations | Optimize data \ | playwright | 1,632 | new |
| pricing | Reduce Grafana Cloud Logs costs \ | playwright | 1,957 | new |
| features | Cloud Infrastructure Observability \ | Grafana Labs | playwright | 1,914 |
| features | Cloud Provider Observability \ | Grafana Labs | playwright | 1,965 |
| features | Digital Experience Monitoring (DEM) & RUM \ | Grafana Labs | playwright | 2,133 |
| features | Full-Stack Observability Platform \ | Grafana Labs | playwright | 1,992 |
| features | Grafana: The open and composable observability platform \ | playwright | 1,971 | new |
| features | Site reliability engineering \ | Grafana Labs | static | 1,106 |
| features | Grafana Assistant Investigations \ | static | 2,281 | new |
| features | Grafana Assistant Investigations \ | static | 2,281 | new |
| integrations | Technical documentation \ | static | 992 | new |
| integrations | Visualization and monitoring integrations \ | static | 944 | new |
| integrations | Grafana Cloud documentation \ | static | 571 | new |
Features
| Page type | Evidence | Source |
|---|---|---|
| features | [ | https://grafana.com/solutions/cloud-infrastructure-observability/ |
| features | Grafana Labs is a Leader in the 2026 Gartner® Magic Quadrant™ for Observability Platforms. | https://grafana.com/solutions/cloud-infrastructure-observability/ |
| features | ](/analyst-reports/gartner-magic-quadrant-observability-platforms/)Learn more | https://grafana.com/solutions/cloud-infrastructure-observability/ |
| features | DownloadsContact Us | https://grafana.com/solutions/cloud-infrastructure-observability/ |
| features | Infrastructure and cloud provider observability | https://grafana.com/solutions/cloud-infrastructure-observability/ |
| features | Monitor Kubernetes, AWS, Microsoft Azure, Google Cloud, Linux hosts, NGINX servers, and more—all from one AI-powered platform. | https://grafana.com/solutions/cloud-infrastructure-observability/ |
| features | Create free accountDocs | https://grafana.com/solutions/cloud-infrastructure-observability/ |
| features | Comprehensive Kubernetes visibility | https://grafana.com/solutions/cloud-infrastructure-observability/ |
| features | Quickly configure and troubleshoot your environment, optimize resources, and get AI-powered insights so you can move even faster | https://grafana.com/solutions/cloud-infrastructure-observability/ |
| features | All your clouds, one view | https://grafana.com/solutions/cloud-infrastructure-observability/ |
| features | Monitor the health and performance of all your AWS, Azure, and Google Cloud workloads in one fully managed platform | https://grafana.com/solutions/cloud-infrastructure-observability/ |
| features | Tailored integrations | https://grafana.com/solutions/cloud-infrastructure-observability/ |
| features | <table><tbody><tr><td><p>Get a Grafana-based observability stack up and running in minutes. Choose prebuilt settings for more than 100 different targets, including Linux, Windows, and more</p></td></tr></tbody></table> | https://grafana.com/solutions/cloud-infrastructure-observability/ |
| features | Trusted by everyone from startups to the Fortune 500 | https://grafana.com/solutions/cloud-infrastructure-observability/ |
| features | [](#observability-solutions-at-every-layer)Observability solutions at every layer | https://grafana.com/solutions/cloud-infrastructure-observability/ |
| features | Use Grafana Cloud for full-stack observability across applications, infrastructure, Kubernetes, and users: | https://grafana.com/solutions/cloud-infrastructure-observability/ |
| features | [Database Observability | https://grafana.com/solutions/cloud-infrastructure-observability/ |
| features | Database Observability | https://grafana.com/solutions/cloud-infrastructure-observability/ |
| features | ](/products/cloud/database-observability/?pg=solutions-cloud-infrastructure-observability&plcmt=observability-solutions-at-every-layer-cta-1)[Digital Experience Monitoring | https://grafana.com/solutions/cloud-infrastructure-observability/ |
| features | Digital Experience Monitoring | https://grafana.com/solutions/cloud-infrastructure-observability/ |
Pricing and plans
| Page type | Evidence | Source |
|---|---|---|
| pricing | Start free | https://grafana.com/pricing/ |
| pricing | $19/ month + usage | https://grafana.com/pricing/ |
| pricing | Ready for scaling with more retention, basic support, and usage-based pricing. | https://grafana.com/pricing/ |
| pricing | Sign up | https://grafana.com/pricing/ |
| pricing | Everything in Free plus: | https://grafana.com/pricing/ |
| pricing | Unlimited access to all Grafana Cloud services; simply pay as you go above the free tier | https://grafana.com/pricing/ |
| pricing | $25,000/ year spend commit | https://grafana.com/pricing/ |
| pricing | Contact us | https://grafana.com/pricing/ |
| pricing | [](#pricing-philosophy)Pricing philosophy | https://grafana.com/pricing/ |
| pricing | [](#scalable-pricing)Scalable pricing | https://grafana.com/pricing/ |
| pricing | Use the interactive calculator to see what you'll pay at your scale. Pricing is volume-based and tiered, so your effective rate drops automatically as you grow. | https://grafana.com/pricing/ |
| pricing | [](#product-pricing)Product pricing | https://grafana.com/pricing/ |
| pricing | All the details you need to know about pricing and plans. | https://grafana.com/pricing/ |
| pricing | Start free | https://grafana.com/pricing/ |
| pricing | Actually useful free tier with access to everything that Grafana Cloud has to offer. | https://grafana.com/pricing/ |
| pricing | Limited to 10k active series per month | https://grafana.com/pricing/ |
| pricing | $6.50/ 1k seriesi | https://grafana.com/pricing/ |
| pricing | Automatic volume discounts. Pricing at scale. View calculator | https://grafana.com/pricing/ |
| pricing | Sign up | https://grafana.com/pricing/ |
| pricing | Platform fee of $19 per month includes: | https://grafana.com/pricing/ |
Integrations and supported platforms
Product and company updates
No supporting public-page evidence was collected for this category.
Rank tracking
Persistent keyword baselines and position movement.
This analysis created the first position baseline at 2026-10-20T15:48:26.411Z. Movement appears after the next fresh analysis using the same location and language.
Features
Features and capabilities
Core functions and evidence-backed product capabilities.
| Capability | What it does |
|---|---|
| On-call scheduling | Build rotations in the UI or as code, trade shifts, and catch coverage gaps S1. |
| Alert routing | Connect any alert source with built-in Grafana Alerting and 20+ integrations, routing by label or template S1. |
| Incident declaration | Declare incidents from dashboard panels or Explore mode, attaching panels and queries as evidence S1. |
| AI investigations | Launch AI investigations when alerts fire or incidents are declared, with Grafana Assistant analyzing telemetry S1. |
| Post-incident review | Automatically convert timelines into structured post-incident reviews S1. |
| Mobile response | Reach responders via mobile app, Slack, Teams, SMS, phone, email, with critical alerts breaking through DND S1. |
| ITSM integration | Integrate with Jira, ServiceNow, GitHub, and more to automate workflows S1. |
Integrations and ecosystem
Connected products, exports, APIs, and workflow compatibility.
| Integration or interface | Type | What it enables |
|---|---|---|
| Grafana Alerting | Integration | Connects alerts from Grafana Cloud directly into IRM S1. |
| Alertmanager, Datadog, ServiceNow, webhooks | Integration | Allows importing alerts from external monitoring tools S1. |
| Slack, Microsoft Teams | Integration | Enables responders to acknowledge, resolve, or silence alerts and manage shifts S1. |
| Mobile app | Mobile app | Provides on-the-go incident response and management S1. |
| Jira, ServiceNow, GitHub | Integration | Integrates with ITSM tools to customize incident workflows S1. |
| API and Terraform | API/SDK | Supports building schedules and managing IRM as code S1. |
Pricing
Pricing and plans
Published plans, free access, trials, credits, and pricing limitations.
| Plan or offer | Verified price and billing | Included | Limits |
|---|---|---|---|
| Free | $0 S167 | Up to 3 active IRM users per month S1 | Community support S167 |
| Pro | From $20 per active IRM user per month S1 S167 | Usage-based, plus $19/month platform fee S1 S167 | Automatic volume discounts S1 |
| Enterprise | Custom, annual commit from $25,000/year S1 S167 | Premium support, cloud or self-hosted deployment S167 | Not established |
Competition
Competitive landscape
Domains competing for the same organic search demand.
Sampled competitors
| Competitor | First-page appearances | Sampled queries | Average position | Queries observed |
|---|---|---|---|---|
| logicmonitor.com | 1 | 1 | 2 | alert notification template |
| github.com | 1 | 1 | 2 | alloy grafana |
| canva.com | 1 | 1 | 3 | alert notification template |
| docs.aws.amazon.com | 1 | 1 | 4 | alert notification template |
| singlewire.com | 1 | 1 | 5 | alert notification template |
| youtube.com | 1 | 1 | 5 | alloy grafana |
| prometheus.io | 1 | 1 | 6 | alert notification template |
| fema.gov | 1 | 1 | 7 | alert notification template |
| civicplus.help | 1 | 1 | 8 | alert notification template |
Website intelligence — Collected evidence
Customers, testimonials, and first-party review claims
No supporting public-page evidence was collected for this category.
Independent review sources discovered
No links to supported independent review platforms were discovered on the collected pages.
Backlink profile
Authority and referring-domain signals.
Backlink comparison profile
- Domain rating: 89/100
- Backlinks: 1,560,383
- Referring domains: 34,778
- Dofollow backlinks: 85.0%
- Dofollow referring domains: 84.0%
| Source DR | Source title | Anchor | Source URL | Target URL |
|---|---|---|---|---|
| 81 | What is a Vector Database & How Does it Work? Use Cases + Examples \ | Pinecone | Grafana | https://www.pinecone.io/learn/vector-database/ |
| 72 | DBeaver PRO \ | Manage 100+ Databases in One Place | Grafana | https://dbeaver.com/ |
| 97 | GitHub - grafana/grafana: The open and composable observability and data visualization platform. Visualize metrics, logs, and traces from multiple sources like Prometheus, Loki, Elasticsearch, InfluxDB, Postgres and many more. · GitHub | grafana.com | https://github.com/grafana/grafana | https://grafana.com/ |
| 78 | Load testing for engineering teams \ | Grafana k6 | Legal and Security | https://k6.io/ |
| 84 | What is APM (Application performance monitoring)? | Grafana | https://www.dynatrace.com/news/blog/what-is-apm/ | https://grafana.com/ |
| 97 | List of TCP and UDP port numbers | "Configure Grafana" | https://en.wikipedia.org/wiki/List_of_TCP_and_UDP_port_numbers | https://grafana.com/docs/grafana/latest/setup-grafana/configure-grafana/ |
| 33 | Uptime Kuma - A Fancy Self-Hosted Monitoring Tool | Grafana | https://uptimekuma.co/ | https://grafana.com/ |
| 80 | Grafana Labs \ | Carahsoft | — | https://www.carahsoft.com/grafana-labs |
| 87 | Overview \ | Prometheus | Grafana | https://prometheus.io/docs/introduction/overview/ |
| 56 | localhost:3000 - Development Server Port Guide | Grafana | https://pinggy.io/know_your_port/localhost_3000/ | https://grafana.com/ |
Collection decision
The Scout search index remains intentionally excluded from automatic Scout analysis. This Scout traffic model profile costs 5 credits (0.5 cents) and is included in the first comparison run so its usefulness can be judged before the recurring collection is finalized.
AI visibility
Measured ChatGPT and Google AI mentions with cited sources.
AI-assistant referral traffic
- Estimated current generative-AI referral share: 2.2%
| Month | Traffic share | Source |
|---|---|---|
| — | — | All AI assistants |
| — | — | All AI assistants |
| — | — | All AI assistants |
Website intelligence — Collected evidence
Site-stated AI capabilities
| Page type | Evidence | Source |
|---|---|---|
| other | Avoid lock-in and ensure reliability with Grafana Cloud. The AI-powered platform built on open standards unifies metrics, logs, traces, profiles, and business data. | https://grafana.com/ |
| other | AI for observability. Observability for AI. One platform for both. | https://grafana.com/ |
| other | [](#ai-for-modern-operations)AI for modern operations | https://grafana.com/ |
| other | Use Grafana Assistant to understand production telemetry, Investigations to accelerate root cause analysis, and Agent Observability to evaluate and improve production AI agents. All in one OpenTelemetry-native platform. | https://grafana.com/ |
| other | ](/products/cloud/ai-tools-for-observability/?pg=hp&plcmt=marketecture-ai-powered-observability)[ | https://grafana.com/ |
| other | [](#ai-week-recap-see-whats-next-for-ai-in-production)AI Week recap: See what's next for AI in production | https://grafana.com/ |
| other | Learn how teams are using observability to confidently operate AI-powered systems at scale. | https://grafana.com/ |
| features | Monitor Kubernetes, AWS, Microsoft Azure, Google Cloud, Linux hosts, NGINX servers, and more—all from one AI-powered platform. | https://grafana.com/solutions/cloud-infrastructure-observability/ |
| features | AI-powered analysis for guidance on incident response, workload rightsizing, and cost-saving suggestions | https://grafana.com/solutions/cloud-infrastructure-observability/ |
| features | Unify frontend, application, infrastructure, and database observability in Grafana Cloud, so your team and AI agents can find root causes faster without switching tools or losing context. | https://grafana.com/solutions/full-stack-observability/ |
| features | Use Grafana Cloud for end-to-end visibility across your entire observability stack with AI-driven context: | https://grafana.com/solutions/full-stack-observability/ |
| features | Monitor Kubernetes, AWS, Microsoft Azure, Google Cloud, Linux hosts, NGINX servers, and more—all from one AI-powered platform. | https://grafana.com/solutions/cloud-infrastructure-observability/ |
| features | Quickly configure and troubleshoot your environment, optimize resources, and get AI-powered insights so you can move even faster | https://grafana.com/solutions/cloud-infrastructure-observability/ |
| features | Let Grafana Assistant generate dashboards with the right variables and RED/USE-style panels | https://grafana.com/solutions/cloud-provider-observability/ |
| features | Grafana Assistant handles alert analysis and dashboard building and context follows you from a cloud alert to the resource that caused it | https://grafana.com/solutions/cloud-provider-observability/ |
| features | Unify frontend, application, infrastructure, and database observability in Grafana Cloud, so your team and AI agents can find root causes faster without switching tools or losing context. | https://grafana.com/solutions/full-stack-observability/ |
| features | Find issues faster with AI | https://grafana.com/solutions/full-stack-observability/ |
| pricing | This page is also available in Markdown, which may be easier for automated readers and AI tools to parse than HTML. The Markdown version is available at https://grafana.com/docs/grafana-cloud/platform/cost-management-and-billing/analyze-costs/reduce-costs/logs-costs.md, or by sending Accept: text/markdown to https://grafana.com/docs/grafana-cloud/platform/cost-management-and-billing/analyze-costs/reduce-costs/logs-costs/. For broader documentation discovery, the curated index is available at https://grafana.com/llms.txt and the complete index is available at https://grafana.com/llms-full.txt. | https://grafana.com/docs/grafana-cloud/platform/cost-management-and-billing/analyze-costs/reduce-costs/logs-costs/ |
| integrations | 📢 Registration + agenda now live Explore the latest Grafana Cloud and AI solutions, learn tips & tricks from demos and hands-on workshops, and get actionable advice to advance your observability strategy. Register now and get 50% off - limited tickets available (while they last!). | https://grafana.com/docs/grafana-cloud/observe-and-act/adaptive-telemetry/ |
| integrations | This page is also available in Markdown, which may be easier for automated readers and AI tools to parse than HTML. The Markdown version is available at https://grafana.com/docs/grafana-cloud/observe-and-act/adaptive-telemetry.md, or by sending Accept: text/markdown to https://grafana.com/docs/grafana-cloud/observe-and-act/adaptive-telemetry/. For broader documentation discovery, the curated index is available at https://grafana.com/llms.txt and the complete index is available at https://grafana.com/llms-full.txt. | https://grafana.com/docs/grafana-cloud/observe-and-act/adaptive-telemetry/ |
These are first-party product claims, not independent measurements of AI-search visibility.
Marketing opportunities
Actions calculated directly from the collected evidence.
| Opportunity | Recommended action | Evidence |
|---|---|---|
| Competitor gap | Review the sampled queries where logicmonitor.com appears. | 1 first-page appearances across alert notification template |
Website intelligence — Collected evidence
Website evidence gaps
- customers: no usable public page was collected; verify whether the site publishes this evidence.
- reviews: no usable public page was collected; verify whether the site publishes this evidence.
- changes: no usable public page was collected; verify whether the site publishes this evidence.
- identity: no usable public page was collected; verify whether the site publishes this evidence.
- technical: no usable public page was collected; verify whether the site publishes this evidence.
Trust and proof
Customers, proof, and reviews
Published proof, customer signals, and review evidence.
Independent reviews
| Platform | Page | How it was found | Note |
|---|---|---|---|
| G2 | Compare Grafana Labs and Prometheus | Grounded web search | Grafana Labs(131)4.5 out of 5Grafana Labs By Grafana Labs Prometheus(58)4.4 out of 5Prometheus ... Grafana Labs Star Rating (131) 4.5 out of 5 ... Labs has been extremely disappointing and frustrating. We briefly tested Grafana Cloud’s Prometheus |
| RFP.wiki | Grafana Labs · Time to Value: Setup & First Wins (2026) | Grounded web search | / Score & Rating / Details & Insights / / --- / --- / --- / / G2 / 4.5 / 161 reviews / / / ... / 4.6 / 73 reviews / / Gartner Peer Insights / 4.5 / 618 reviews / / RFP.wiki Score / 4.0 / Review Sites Score Average: 4.5 Features Scores Average: 4.4 / |
| G2 | Compare Grafana Labs and IBM Instana Social Share Options | Grounded web search | Grafana Labs(131)4.5 out of 5Grafana Labs ... Our company’s experience with Grafana Labs has been extremely disappointing and frustrating. We briefly tested Grafana Cloud’s Prometheus service—at most for an hour—and encountered immediate technical limits |
Customer proof
| Proof type | Named customer or source | Evidence |
|---|---|---|
| Case study | ASOS | customer case study — Today, roughly 800 ASOS engineers use Grafana dashboards. (Reducing MTTR with Grafana Cloud: Inside ASOS’ observability stack / Grafana Labs) |
| Case study | The Trade Desk | customer case study — The benefits of Grafana Cloud were almost instantaneous. (The Trade Desk migrated to a modern monitoring system with Grafana Cloud / Grafana Labs) |
| Case study | MIT Open Learning | customer case study — With Grafana Cloud, Adaptive Logs and Adaptive Metrics turned cost control into something the team could act on without losing signal. (How MIT Open Learning unified observability with Grafana Cloud to scale toward a billion learners) |
| Case study | MiQ | customer case study — Ipuvi and Ambarish recently spoke with Grafana Labs about how MiQ’s phased migration to Grafana Cloud delivered just that, cutting debugging time from nearly an hour to under 15 minutes and reducing costs by $10,000 a… (How Grafana Cloud transformed MiQ’s observability with unified logs, metrics, and traces) |
Independent mentions
- Success stories and case studies / Grafana Labs — With over 25 million global users, Grafana has inspired many different use cases. From full stack observability at Fortune 100 companies to next-level monitoring from space, discover how our customers and community members are leveraging the Grafana LGTM
- Lower costs, more visibility: Inside Optro’s migration to Grafana Cloud / Grafana Labs — Once workloads began flowing into Grafana Cloud, the impact was immediate. Adaptive Metrics, a popular feature in Grafana Cloud that aggregates unused and partially used metrics into lower cardinality versions, proved to be a game changer: Within one day of the completed migration, Optro cut its metrics ingestion by more than half. ## Unlocking value with
- From ELK to Grafana Loki: How eCommerce leader Blinkit modernized their logging stack with Grafana Cloud / Grafana Labs — -and-essentials delivery company serving millions of consumers across India. Customers can use a mobile app to place ... and Blinkit has 2,000-plus employees and warehouses across the country to ensure that all deliveries are made in 10 minutes or less
External links were grounded in one live web search. Search snippets are leads, not independently scraped page content; rejected links remain available in Review evidence.
Company, security, and trust
Ownership, policies, security signals, and public trust evidence.
| Signal | Finding | Source |
|---|---|---|
| Company and ownership | Not published on the collected pages. | — |
| Contact and support | Go from firing alert to resolved incident with Grafana Cloud IRM. Automatically notify the right on-call responders; declare an incident from an alert; coordinate your response from Slack, Microsoft Teams, or your phone; | source |
| Legal and privacy | Meet strict standards with SOC 2, GDPR, PCI, and more. FedRAMP High and DoD IL5 authorization available with Grafana Federal Cloud | source |
| Security and compliance | Meet strict standards with SOC 2, GDPR, PCI, and more. FedRAMP High and DoD IL5 authorization available with Grafana Federal Cloud | source |
| Uptime and status page | Go from firing alert to resolved incident with Grafana Cloud IRM. Automatically notify the right on-call responders; declare an incident from an alert; coordinate your response from Slack, Microsoft Teams, or your phone; | source |
| Domain registered | 2014-05-27 | — |
| Domain expires | 2027-05-27 | — |
Not found on the collected pages: company and ownership. This only means Scout did not find it on the pages it read; it says nothing about the company itself.
Documentation and product updates
Help resources, product guidance, and visible changes over time.
| Resource or update | Type | What is available | Date or freshness |
|---|---|---|---|
| Technical documentation / Grafana Labs | Documentation | Technical documentation for Grafana Labs products and services. (source) | Not dated |
Not found in the collected public sources: public roadmap, changelog or release notes, status page, separate help center or knowledge base.
Technical
Technical and delivery signals
Delivery model, platforms, API, data ownership, reliability claims and release activity.
| Signal | Finding | Source |
|---|---|---|
| Delivery model (cloud, self-hosted, desktop, browser extension) | Available as Public Cloud, Federal Cloud, or Bring Your Own Cloud S1. | S1 |
| Platforms and apps | Mobile app for incident response on the go S1. | S1 |
| API and extensibility (API, SDK, webhooks, MCP, plugins) | Supports API and Terraform for schedules as code S1. | S1 |
| Data ownership and export | Not published on the collected pages. | — |
| Performance and reliability claims | Not published on the collected pages. | — |
| Release activity | Not published on the collected pages. | — |
Measured infrastructure
Domain, certificate, and hosting signals, measured directly.
| Signal | Finding |
|---|---|
| Domain registered | 2014-05-27 — eNom, LLC |
| Domain expires | 2027-05-27 |
| First archived | 2013-07-18 — web archive |
| TLS certificate | DigiCert Inc, valid, expires 2027-04-02 |
| Security headers | HSTS, X-Frame-Options |
| Headers not served | CSP, X-Content-Type-Options, Referrer-Policy |
| Server header | nginx |
| Mail handled by | aspmx.l.google.com, alt1.aspmx.l.google.com |
| Nameservers | ns-1625.awsdns-11.co.uk, ns-1007.awsdns-61.net |
Not measurable: rdap: exceeded the overall budget; wayback: exceeded the overall budget; tls: exceeded the overall budget; dns: exceeded the overall budget; headers: exceeded the overall budget. A gap here means the lookup was unavailable, not that the finding is negative.
Technical site audit
A bounded multi-page crawl with page-level issues and URLs.
Scout — Bounded technical crawl
- Pages crawled: 15 of 15 maximum
- Technical health: 90/100
- Critical issues: 0
- Warnings: 25
- Notices: 10
Issues
Crawled pages
| Status | Title | H1s | Words | Response | URL |
|---|---|---|---|---|---|
| 200 | Full-stack observability for the agentic era \ | Grafana Labs | 1 | 917 | 133 ms |
| 200 | 2026 Gartner® Magic Quadrant™ for Observability Platforms \ | Grafana Labs | 1 | 544 | 532 ms |
| 200 | Grafana get started \ | Cloud, Self-managed, Enterprise | 1 | 627 | 265 ms |
| 200 | Contact us \ | Grafana Labs | 1 | 467 | 246 ms |
| 200 | Grafana Pricing \ | Free, Pro, Enterprise \ | Grafana Labs | 1 | 3530 |
| 200 | Technical documentation \ | Grafana Labs | 1 | 955 | 92 ms |
| 200 | Grafana Cloud | 0 | 9 | 50 ms | https://grafana.com/auth/sign-in/ |
| 200 | Grafana Cloud | 0 | 9 | 54 ms | https://grafana.com/auth/sign-up/create-user/ |
| 200 | Grafana Assistant \ | AI-Powered Observability in Grafana Cloud \ | Grafana Labs | 1 | 1294 |
| 200 | Grafana Cloud Investigations: faster incident response \ | Grafana Labs | 1 | 808 | 95 ms |
| 200 | Agent Observability \ | Observe & Improve AI Agents with Grafana Cloud \ | Grafana Labs | 1 | 764 |
| 200 | Grafana Assistant \ | AI-Powered Observability in Grafana Cloud \ | Grafana Labs | 1 | 1294 |
| 200 | Adaptive Telemetry \ | Grafana Cloud \ | Grafana Labs | 1 | 1034 |
| 200 | Full-Stack Observability Platform \ | Grafana Cloud \ | Grafana Labs | 1 | 943 |
| 200 | Visualization and monitoring integrations \ | Grafana Labs | 1 | 680 | 245 ms |
This is a bounded Scout crawl. Core Web Vitals and Lighthouse scores are not claimed unless a dedicated performance audit is connected.
Search Console and Analytics
First-party search and behavioral data connection state.
Modeled acquisition channels
| Channel | Estimated share |
|---|---|
| direct | 35.0% |
| search | 49.7% |
| search organic | 46.0% |
| search paid | 3.7% |
| social | 2.2% |
| social organic | 2.0% |
| social paid | 0.2% |
| referrals | 8.4% |
| paid referrals | 0.2% |
| 1.3% | |
| gen ai | 2.2% |
| affiliate | 1.0% |
| other | 0.0% |
First-party connections
| Integration | Status | Data available after connection |
|---|---|---|
| Google Search Console | Not connected | Clicks, impressions, CTR, average position, queries, pages, countries, and devices |
| Google Analytics | Not connected | Organic sessions, engagement, landing pages, conversions, geography, and devices |
No first-party Search Console or Analytics numbers are shown until the site owner authorizes the corresponding Google account. Scout traffic model values above are modeled estimates, not private analytics totals.
Limits and method
Limitations and open questions
Known constraints and missing evidence from the collected pages.
The collected pages do not mention specific competitors. Evidence gaps include lack of detailed security certifications, uptime guarantees, and independent customer reviews. Open questions remain about data export capabilities and specific performance metrics.
Sources, method, and limitations
Evidence inventory, collection method, provider use, and constraints.
This report is based on 15 collected pages from grafana.com, including product pages for IRM, Grafana Cloud, SLO, and pricing, plus technical documentation. Static and browser rendering rendering were used; external proof search was performed but no third-party reviews were collected. Limitations: no independent verification of claims, and some sections rely on vendor-provided information.
- Official Websitehttps://grafana.com/products/cloud/irm/Verified
- Official Websitehttps://grafana.com/products/cloud/Verified
- Official Websitehttps://grafana.com/products/cloud/slo/Verified
- Documentationhttps://grafana.com/docs/Verified
- Pricing Pagehttps://grafana.com/pricing/Verified
- Pricing Pagehttps://grafana.com/grafana/dashboards/13514-aws-billing-dashboard/Verified
- Pricing Pagehttps://grafana.com/grafana/dashboards/139-aws-billing/Verified
- Pricing Pagehttps://grafana.com/grafana/dashboards/7651-billing-usage/Verified
- Pricing Pagehttps://grafana.com/grafana/dashboards/8932-cost-analysis-by-cluster-correct-price/Verified
- Official Websitehttps://grafana.com/solutions/cloud-infrastructure-observability/Verified
- Official Websitehttps://grafana.com/solutions/cloud-provider-observability/Verified
- Official Websitehttps://grafana.com/solutions/digital-experience-monitoring/Verified
- Official Websitehttps://grafana.com/solutions/full-stack-observability/Verified
- Official Websitehttps://grafana.com/solutions/opentelemetry/Verified
- Official Websitehttps://grafana.com/solutions/site-reliability/Verified
- Review Sitehttps://www.g2.com/compare/grafana-labs-vs-prometheusVerified
- Review Sitehttps://www.rfp.wiki/it-security/observability-platforms/grafana-labsVerified
- Articlehttps://grafana.com/success/asos/Verified
- Articlehttps://grafana.com/success/thetradedesk/Verified
- Articlehttps://grafana.com/success/mit/Verified
- Articlehttps://grafana.com/success/miq/Verified
- Articlehttps://grafana.com/success/Verified
- Review Sitehttps://www.g2.com/compare/grafana-labs-vs-ibm-instanaVerified
- Articlehttps://grafana.com/success/auditboard/Verified
- Articlehttps://grafana.com/success/blinkit/Verified