564 stars · Apache-2.0 · v2.6.0 (2024-02-19) · Track this in Scout
Turns a written reliability target into a measured number and a remaining budget.
▶Repo detailsthe review · specs · pros & cons · install
What it does
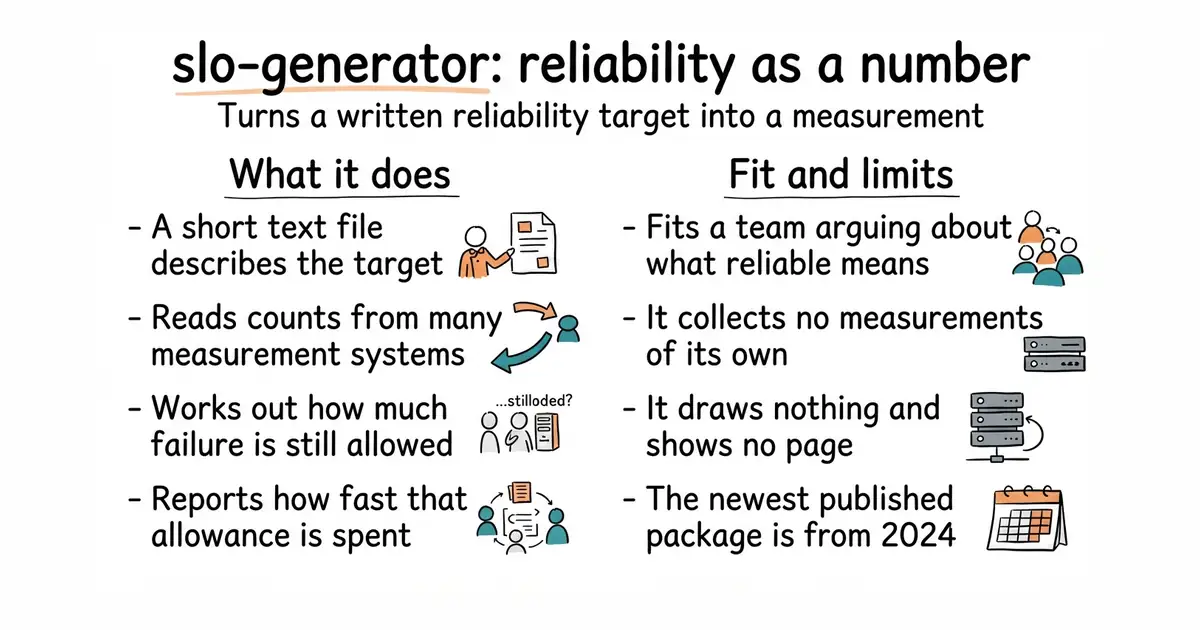
You describe a target in a small YAML file, which is a plain text format of labelled lines. The description says what counts as a good event, what counts as a total event, and what share of them must be good. It then reads those counts from wherever the measurements live, including Prometheus, Datadog, Dynatrace, Elasticsearch and several Google Cloud services. It computes the achieved rate, the error budget, which is how much failure the target still allows, and the burn rate, which is how fast that budget is being spent. The results can be written out to a file, to a monitoring system, or to a spreadsheet-style store, so an alert or a dashboard can read them. The same descriptions can be kept in version control and reviewed like code. It does not collect any measurements itself and it draws nothing: something else has to be counting requests already, and something else has to show the result.
Why it matters
Who it suits. Anyone who already collects numbers about a service and still cannot answer whether it was reliable last month. It suits a small team moving from "somebody noticed it was down" to a figure they can agree on in advance. Skip it if nothing is being measured yet, because this tool needs a counter to read and gives nothing without one.
Verdict. Worth an afternoon if reliability is becoming an argument rather than a fact, and this entry carries a warning about dates that applies to the whole edition. Its newest published package is version 2.6.0 from March 2024, and anyone reading that alone would call the project dead. Code was pushed on 12 August 2026. A release date is not a code date. What to use instead depends on the setup: if everything is already in Prometheus, slok/sloth from Edition 56 is a single small program that writes the Prometheus rules itself and is less to learn, and pyrra-dev/pyrra from Edition 45 adds a page showing the remaining budget. This one earns its place by reading from many different measurement systems rather than one.
- Reads from many measurement systems, including several that the Prometheus-only tools cannot touch.
- The targets are plain text files, so they can be reviewed and kept in version control.
- Computes the burn rate, which is the number that tells you to act now rather than next week.
- Useless without an existing measurement system, and setting one of those up is the bigger job.
- The newest published package is from March 2024, so anyone judging it by releases will skip it.
- Documentation assumes a reader who already knows what a service level objective is.
 slok/sloth
Apache-2.0, covered in Edition 56; a single small program that generates Prometheus rules from a short target description, simpler but tied to Prometheus alone.
Track this in Scout pyrra-dev/pyrra
Apache-2.0, covered in Edition 45; the same job for Prometheus with a web page that shows the remaining error budget, which this one does not draw.
Track this in Scout
python3 -m venv venv
source venv/bin/activate
pip install slo-generator