Overview
Summary
The useful answer before the supporting detail.
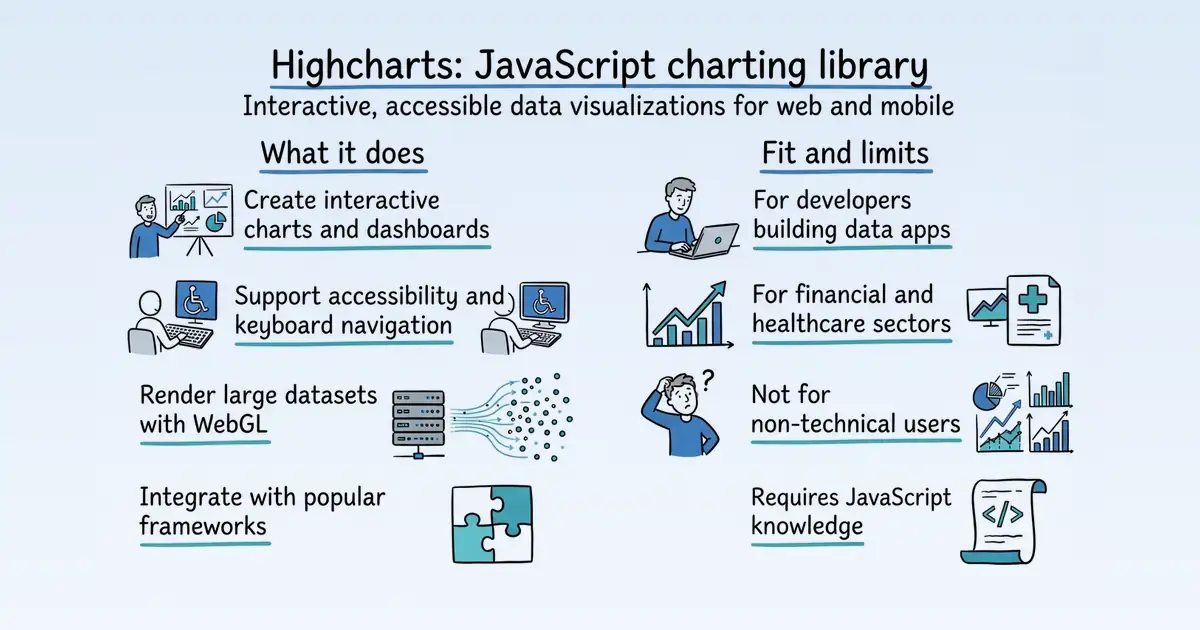
Highcharts is a JavaScript charting library for creating interactive, accessible data visualizations for web and mobile platforms S169. Developers use it to build charts, dashboards, and grids that integrate with frameworks like Angular, React, and Vue S99. Its practical value lies in its flexibility, accessibility features, and support for large datasets S99 S83.
Product identity and positioning
Name, category, positioning, audience, and first-party claims.
- Identity: Highcharts is a JavaScript charting library and product suite including Core, Stock, Maps, Gantt, Grid, and Dashboards S99.
- Core purpose: It solves the problem of creating responsive, interactive, and accessible data visualizations for web and mobile S165.
- Intended users: Developers building web apps, dashboards, and data-heavy applications S99.
- Product scope: It is a library and product family, not a single app, with components for charts, stock, maps, gantt, grids, and dashboards S99.
- Positioning: The vendor positions it as a flexible, accessible, and professionally maintained charting solution S99.
- Claimed distinction: It claims one of the most robust accessibility modules in data visualization libraries S99.
Use cases and audiences
Who the product serves and the jobs it is designed to handle.
| Audience | Practical use case |
|---|---|
| Web developers | Build interactive charts and dashboards for web apps S99 S165. |
| Financial analysts | Visualize stock and time-series data with Stock and Morningstar integration S165 S99. |
| Healthcare and finance sectors | Customize charts to match data models and styling S99. |
| Mobile developers | Create charts for mobile apps using iOS and Android integrations S165. |
Traffic and search
SEO analysis
Collected Oct 22, 2026highcharts.com: an estimated 344,422 total monthly visits and about 56,891 monthly organic visits across 4,960 ranking keywords. Scout crawled 15 pages and measured a technical health score of 91/100.
Search summary
The useful answer before the supporting detail.
Highcharts JavaScript charting library: Core, Stock, Maps, Gantt, Grid and Dashboards. Build interactive data visualizations with modern frameworks like React. highcharts.com: an estimated 344,422 total monthly visits and about 56,891 monthly organic visits across 4,960 ranking keywords. Scout crawled 15 pages and measured a technical health score of 91/100.
- Total traffic (modeled): 344,422 monthly visits across all channels.
- Organic search traffic (estimated): 56,891 monthly visits from search.
- Strongest sampled ranking: barchart examples at position 1.
- Leading page in the collected evidence: https://www.highcharts.com/demo/highcharts/bar-chart.
- Closest measured organic competitor: youtube.com, appearing 3 times in the sampled first-page SERPs.
- Technical crawl: 15 pages, health score 91/100.
Website intelligence — Collected evidence
Company identity and positioning
| Page type | Evidence | Source |
|---|---|---|
| integrations | Highcharts JavaScript charting library: Core, Stock, Maps, Gantt, Grid and Dashboards. Build interactive data visualizations with modern frameworks like React. | https://www.highcharts.com/ |
| features | 0 | https://www.highcharts.com/blog/posts/product-updates/ |
| features | Introducing Highcharts Orbit: A Full Analytics Layer for any Highchart | https://www.highcharts.com/blog/posts/product-updates/ |
| features | NewHighcharts OrbitAI-power for every Highchart | https://www.highcharts.com/blog/posts/product-updates/ |
| features | The Boost module is a stripped down renderer and a set of data handling modifications for Highcharts. It bypasses some of the standard Highcharts features, applies some trade-offs and focuses on handling and rendering as many data points as possible as quickly as possible. It renders the data using WebGL on a canvas inside the chart's SVG structure. | https://www.highcharts.com/docs/advanced-chart-features/boost-module |
| features | The Boost module is a "renderer-in-a-module". Including modules/boost.js will, by default, activate boost once the number of points or series exceed either of the [boost thresholds](#series-boosting-versus-chart-boosting) for all series that support it (line, column, bar, treemap, heatmap, scatter, bubble, area, areaspline, arearange, columnrange). | https://www.highcharts.com/docs/advanced-chart-features/boost-module |
| features | For Highcharts from version 12, the import can be simplified to: | https://www.highcharts.com/docs/advanced-chart-features/boost-module |
| features | The main boost configuration is set in the `boost` property in the chart options. See the API for the detailed description of available options. | https://www.highcharts.com/docs/advanced-chart-features/boost-module |
| features | Configuration for a boosted line chart. | https://www.highcharts.com/docs/advanced-chart-features/boost-module |
| features | The former works well in most cases, whereas the latter is meant for charts with large amounts of series (such as monitoring server clusters). | https://www.highcharts.com/docs/advanced-chart-features/boost-module |
| features | The two different modes each has their own threshold value. For chart-level boosting, the threshold is the number of series that must be present in the chart for the boost to “kick in” (50 by default). For series-level boosting, the threshold is the number of points in the series that must be present for that particular series to enter boost mode (5,000 by default). | https://www.highcharts.com/docs/advanced-chart-features/boost-module |
| features | The Boost module contains a WebGL renderer that replaces parts of the SVG renderer. Additionally, it bypasses and simplifies some of the resource-hungry aspects of handling big data. As such, certain features are not available for boosted charts. Most of these features deal with interactivity, such as animation support. But there are a few that relate to visuals as well. | https://www.highcharts.com/docs/advanced-chart-features/boost-module |
Domain performance
Modeled total traffic, six-month trend, engagement, countries, and domain identity.
Total website traffic
| Month | Modeled visits |
|---|---|
| 2026-04 | 497,018 |
| 2026-05 | 535,210 |
| 2026-06 | 486,785 |
| 2026-07 | 414,317 |
| 2026-08 | 375,180 |
| 2026-09 | 344,422 |
Top visitor countries
| Country | Name | Traffic share |
|---|---|---|
| US | United States | 15.6% |
| RU | Russia | 5.8% |
| DE | Germany | 4.7% |
| IN | India | 4.2% |
| KR | Korea, Republic of | 3.7% |
Domain identity
| Signal | Value |
|---|---|
| Registered | Oct 27, 2009 |
| Last changed | Sep 14, 2026 |
| Expires | Oct 27, 2027 |
| WHOIS server | whois.verisign-grs.com |
| DNSSEC | Signed |
| Nameservers | FRED.NS.CLOUDFLARE.COM, LISA.NS.CLOUDFLARE.COM |
Website capture
Organic keywords
Top keywords and an independent Google result page.
Top organic keywords
| Keyword | Volume | CPC | Estimated value |
|---|---|---|---|
| highcharts | 5,520 | $1.49 | $4,560 |
| 하이차트 | 860 | $0.00 | $450 |
| highstock | 5,900 | $3.41 | $430 |
| oscillator chart highcharts | 320 | $0.00 | $430 |
| highcharts heatmap | 400 | $1.16 | $370 |
Independent Google result page
Query: barchart examples
| Position | Title | URL | Description |
|---|---|---|---|
| 1 | 7 Bar Chart Examples for Real-World Projects | https://www.goldensoftware.com/bar-chart-examples/ | A highly practical bar chart example is the Hydrograph Bar Chart, which combines rainfall and stream discharge data to show how one variable responds to another ... |
| 2 | Types of Bar Charts:Simple, Multiple and Component ... | https://www.youtube.com/watch?v=cH_oDgNeI-M | In this video, I describe the 3 most commonly used types of Bar Charts. :Simple, Multiple and Component Bar Charts |
| 3 | Bar chart Demo | https://www.highcharts.com/demo/highcharts/bar-chart | Column and bar charts. You can download and try out all Highcharts products for free. We make it easy for developers to create charts and dashboards for web ... |
| 4 | Barchart | Market Data, News, Trading Tools, and Analysis | https://www.barchart.com/ | Barchart is the leading provider of real-time stock and commodities data. Keep tabs on your portfolio with screeners, customizable charts and analysis. |
| 5 | JavaScript Chart Examples — 300+ Live Demos | https://www.amcharts.com/demos/ | Browse 300+ live JavaScript chart examples: bar, line, pie, stock, Gantt, Sankey, treemap, heatmap, word cloud and maps, each with its JavaScript source. |
| 6 | Bar Chart | Introduction to Statistics | https://www.jmp.com/en/statistics-knowledge-portal/exploratory-data-analysis/bar-chart | Figure 1 is an example of a bar chart for responses to a survey question. all of the examples show bar charts with counts, Below are a few examples of bar ... |
| 7 | Bar chart | https://en.wikipedia.org/wiki/Bar_chart | A bar graph shows comparisons among discrete categories. One axis of the chart shows the specific categories being compared, and the other axis represents a ... |
| 8 | A Complete Guide to Bar Charts | https://www.atlassian.com/data/charts/bar-chart-complete-guide | Examples include state or country, industry type, website access method (desktop, mobile), and visitor type (free, basic, premium). |
| 9 | 7 types of bar charts: ABCs and advantages | https://inforiver.com/insights/7-types-of-bar-charts-abcs-and-advantages/ | Discover the versatility of bar charts, including column, horizontal, lollipop, clustered, stacked, diverging, and waterfall charts. |
| 10 | Bar Chart - GCSE Maths - Steps, Examples & Worksheet | https://thirdspacelearning.com/gcse-maths/statistics/bar-chart/ | Free bar chart GCSE maths revision guide, including step by step examples, exam questions and free {keyword} worksheet. |
Important pages
Pages earning the most estimated search traffic in the sample.
Website intelligence — Collected evidence
Prioritized website intelligence pages
| Type | Page | Words | Change | URL |
|---|---|---|---|---|
| integrations | JavaScript charting library for web apps, dashboards, grids, React and more \ | Highcharts | playwright | 675 |
| features | Product Updates | 455 | new | https://www.highcharts.com/blog/posts/product-updates/ |
| features | Boost module \ | playwright | 4,047 | new |
| features | Highcharts TypeScript Declarations \ | playwright | 3,782 | new |
| integrations | Highcharts Documentation \ | playwright | 2,834 | new |
| integrations | Highcharts integrations for React, Angular, Vue, Python, and more \ | static | 204 | new |
| integrations | Highcharts for Angular \ | Highcharts | static | 705 |
| integrations | Highcharts for Flutter \ | Highcharts | static | 688 |
| integrations | Use Highcharts to add interactive charts to Flutter apps. Includes setup, examples, and common patterns for interactive, accessible charts. \ | static | 735 | new |
| integrations | Highcharts for Node.js \ | Highcharts | static | 725 |
Features
Pricing and plans
No supporting public-page evidence was collected for this category.
Integrations and supported platforms
| Page type | Evidence | Source |
|---|---|---|
| integrations | [Skip to content](#wp--skip-link--target) | https://www.highcharts.com/ |
| integrations | NewHighcharts OrbitAI-power for every Highchart | https://www.highcharts.com/ |
| integrations | NewHighcharts React v5See what's new | https://www.highcharts.com/ |
| integrations | NewHighcharts on DiscordJoin our server | https://www.highcharts.com/ |
| integrations | ](https://discord.com/invite/xHxxcyyy6K) | https://www.highcharts.com/ |
| integrations | Powerful Data Viz | https://www.highcharts.com/ |
| integrations | for real-world apps | https://www.highcharts.com/ |
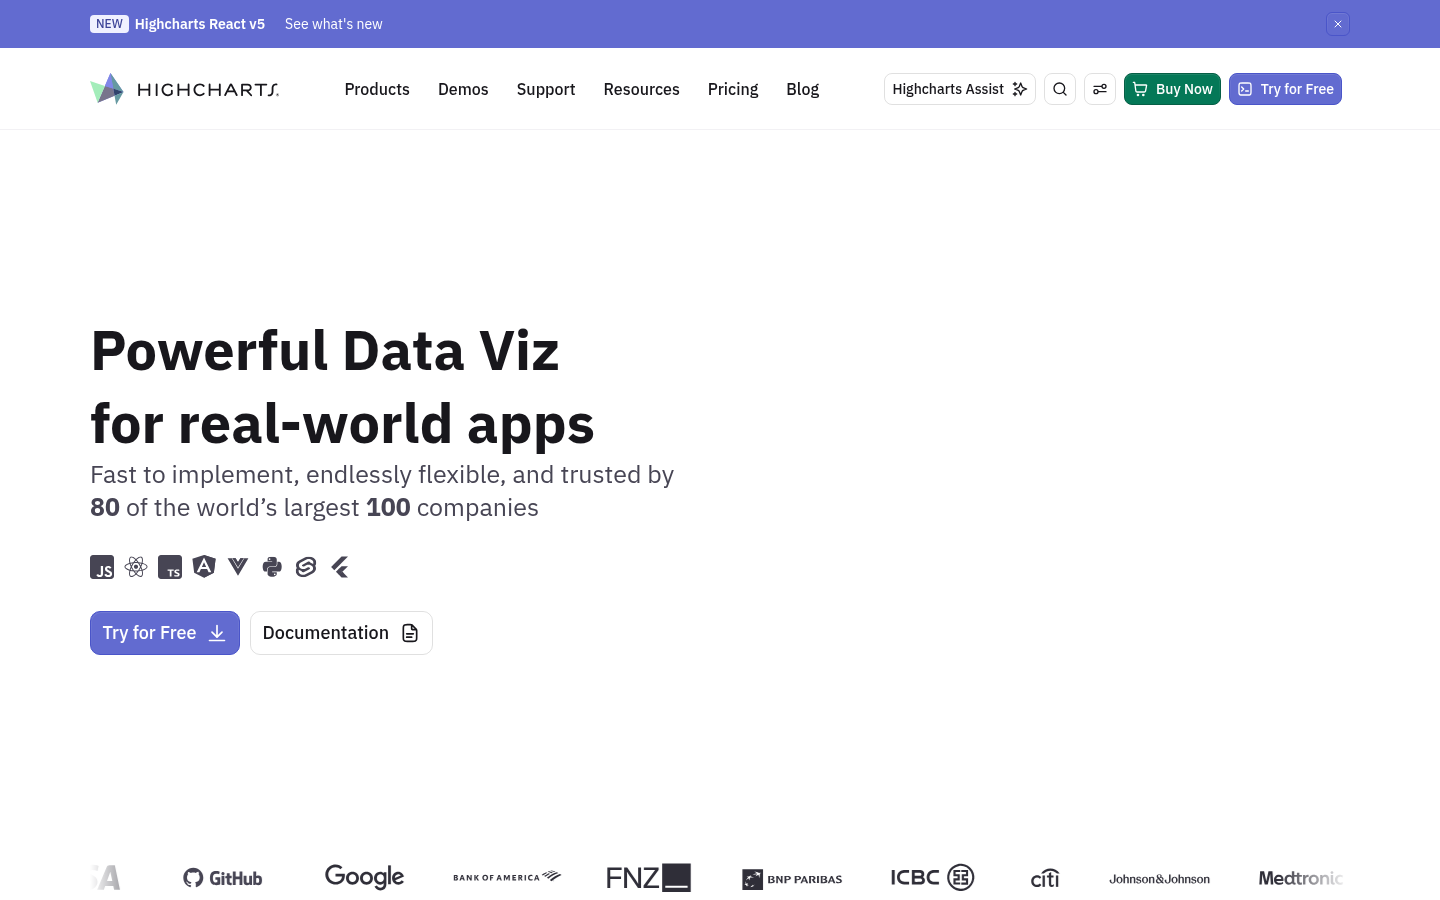
| integrations | Fast to implement, endlessly flexible, and trusted by 80 of the world’s largest 100 companies | https://www.highcharts.com/ |
| integrations | Try for Free | https://www.highcharts.com/ |
| integrations | Documentation | https://www.highcharts.com/ |
| integrations | Developers love Highcharts | https://www.highcharts.com/ |
| integrations | Quick to start | https://www.highcharts.com/ |
| integrations | “Highcharts hits our sweet spot – powerful enough to present complex data, responsive, and easy enough to implement.” | https://www.highcharts.com/ |
| integrations | Systems Development Manager | https://www.highcharts.com/ |
| integrations | Read review on G2 | https://www.highcharts.com/ |
| integrations | Framework friendly | https://www.highcharts.com/ |
| integrations | “Highcharts…integrates seamlessly with component passed frameworks like Angular, React and Vue to make it simple to add charts as components to a UI.“ | https://www.highcharts.com/ |
| integrations | Desktop Support Engineer | https://www.highcharts.com/ |
| integrations | Read review on G2 | https://www.highcharts.com/ |
| integrations | Robust customization | https://www.highcharts.com/ |
Product and company updates
No supporting public-page evidence was collected for this category.
Rank tracking
Persistent keyword baselines and position movement.
This analysis created the first position baseline at 2026-10-22T06:53:32.856Z. Movement appears after the next fresh analysis using the same location and language.
Features
Features and capabilities
Core functions and evidence-backed product capabilities.
| Capability | What it does |
|---|---|
| Accessibility | Provides keyboard navigation, screen reader support, voice input, and high contrast mode for charts S16. |
| Annotations | Allows adding labels and shapes to charts, with a GUI for custom annotation interfaces S31 S23. |
| Boost rendering | Uses WebGL to render large datasets efficiently S83. |
| Breadcrumbs | Aids navigation through drilldown or hierarchical data structures S84. |
| Export | Exports charts to PNG, JPG, PDF, or SVG S165. |
| Framework integrations | Integrates with Angular, React, Vue, and other frameworks S99 S165. |
| Data connectors | Connects to Morningstar's API for financial time-series data S99 S14. |
Integrations and ecosystem
Connected products, exports, APIs, and workflow compatibility.
| Integration or interface | Type | What it enables |
|---|---|---|
| Angular, React, Vue | Framework integration | Add charts as components in these frameworks S99. |
| Morningstar API | Data connector | Fetch and visualize financial time-series data S99 S14. |
| .NET, R, iOS, Android | Platform integration | Use Highcharts in non-JavaScript environments S165. |
| API references | API | Access detailed options and functions for customization S1. |
| Export module | Feature | Download charts as SVG for tactile graphics S16. |
Pricing
Pricing and plans
Published plans, free access, trials, credits, and pricing limitations.
| Plan or offer | Verified price and billing | Included | Limits |
|---|---|---|---|
| Highcharts Core | 366 USD per developer seat per year (subscription); perpetual option at checkout S11 | Core charting library S11 | Internal, SaaS, or OEM licence scope chosen at checkout S11 |
| Stock add-on | +366 USD per developer seat per year S11 | Stock and timeline charts S165 | Requires Core S11 |
| Maps add-on | +128 USD per developer seat per year S11 | Interactive maps S165 | Requires Core S11 |
| Gantt add-on | +73 USD per developer seat per year S11 | Resource allocation charts S165 | Requires Core S11 |
| Dashboards | 264 USD per developer seat per year S11 | Dashboards product S11 | Separate product S11 |
| OEM licence | Contact sales S11 | Custom products, seats, installations S11 | For distributed or hosted products S11 |
Competition
Competitive landscape
Domains competing for the same organic search demand.
Sampled competitors
| Competitor | First-page appearances | Sampled queries | Average position | Queries observed |
|---|---|---|---|---|
| youtube.com | 3 | 2 | 4 | barchart examples, 3d charts |
| geeksforgeeks.org | 1 | 1 | 1 | barchart examples |
| stephanieevergreen.com | 1 | 1 | 1 | 3d charts |
| ibm.com | 1 | 1 | 2 | barchart examples |
| vecteezy.com | 1 | 1 | 2 | 3d charts |
| inetsoft.com | 1 | 1 | 3 | 3d charts |
| ddbm.com | 1 | 1 | 4 | barchart examples |
| dataplatform.cloud.ibm.com | 1 | 1 | 5 | 3d charts |
| mekkographics.com | 1 | 1 | 6 | barchart examples |
| grafana.com | 1 | 1 | 6 | 3d charts |
Website intelligence — Collected evidence
Customers, testimonials, and first-party review claims
No supporting public-page evidence was collected for this category.
Independent review sources discovered
| Platform | Status | Discovered source |
|---|---|---|
| G2 | discovered_not_scraped | https://www.g2.com/products/highcharts/reviews/highcharts-review-122793 |
| G2 | discovered_not_scraped | https://www.g2.com/products/highcharts/reviews/highcharts-review-11532118 |
| G2 | discovered_not_scraped | https://www.g2.com/products/highcharts/reviews/highcharts-review-4660500 |
AI visibility
Measured ChatGPT and Google AI mentions with cited sources.
AI-assistant referral traffic
- Estimated current generative-AI referral share: 0.7%
| Month | Traffic share | Source |
|---|---|---|
| — | — | All AI assistants |
Website intelligence — Collected evidence
Site-stated AI capabilities
No supporting public-page evidence was collected for this category.
These are first-party product claims, not independent measurements of AI-search visibility.
Marketing opportunities
Actions calculated directly from the collected evidence.
| Opportunity | Recommended action | Evidence |
|---|---|---|
| Competitor gap | Review the sampled queries where youtube.com appears. | 3 first-page appearances across barchart examples, 3d charts |
Website intelligence — Collected evidence
Website evidence gaps
- pricing: no usable public page was collected; verify whether the site publishes this evidence.
- customers: no usable public page was collected; verify whether the site publishes this evidence.
- reviews: no usable public page was collected; verify whether the site publishes this evidence.
- changes: no usable public page was collected; verify whether the site publishes this evidence.
- identity: no usable public page was collected; verify whether the site publishes this evidence.
- technical: no usable public page was collected; verify whether the site publishes this evidence.
Trust and proof
Customers, proof, and reviews
Published proof, customer signals, and review evidence.
Independent reviews
No citation-grounded independent review links were found.
Customer proof
| Proof type | Named customer or source | Evidence |
|---|---|---|
| Case study | GitHub | customer case study — In the world of software development and version control, GitHub stands as an indispensable platform for millions of developers worldwide. (How GitHub leverages Highcharts to visualize development activity) |
| Case study | Drivetrain | customer case study — That’s why Drivetrain built an AI-powered strategic finance platform that enables customers to integrate and analyze data from any system so they can get a complete picture of their company’s financial health and use… (Drivetrain and Highcharts: Enabling better business decisions) |
| Case study | Horus | customer case study — When Horus integrated Highcharts Dashboards into their toolkit, they recognized how it elevated their existing dashboard solution, providing their customers with new-found insights. (Horus and Highcharts: Democratizing Data) |
| Testimonial | Campaign Monitor | testimonial — by News In their recent article, Say goodbye to Flash with our all new charts, email marketing provider Campaign Monitor praises Highcharts. (Campaign Monitor endorses Highcharts) |
Independent mentions
- Testmo — Testmo is a software testing tool to manage manual, exploratory, and automated testing activities. ... web user interface to show test results, highlight QA activities over time, and communicate various KPIs (key performance indicators) to software teams.
- Scaling an agricultural data platform: Farmable’s frontend redesign with Highcharts — in a mobile app, mapping fields and logging crops, fertilizers, ... harvests. That data flows into a web portal, where it is structured into reports ... . The web portal is not a typical interactive application. Its primary function is to give
- How Veezoo Turns Data Questions into Visual Answers / Highcharts / Highcharts — Veezoo is an Agentic Analytics platform designed to make it that simple. It enables users to explore their data using natural language prompts. Ask Veezoo’s chat what you want to know and get back charts you can act on and probe for deeper insights. When you’re ready, bring them together in interactive dashboards for monitoring and sharing.
- The Guardian — The article written by the newspaper is about how a team of mathematicians has modeled ... But what is more interesting is that the article not only informs the readers about ... fees but also allows them to experience by themselves the results using an
- Blackboard Ally and Highcharts Working Together — s mission so we needed to ensure the graphs and charts included in our reports met ... standards and worked effectively with screen reader users. Using Highcharts, the people leading accessibility efforts on their campus can access
- Finance — ### Horus Horus uses Highcharts Dashboards to present actionable insights to their customers. Horus use case ### Drivetrain Drivetrain uses Highcharts Core to help deliver AI-powered financial insights.
External links were grounded in one live web search. Search snippets are leads, not independently scraped page content; rejected links remain available in Review evidence.
Company, security, and trust
Ownership, policies, security signals, and public trust evidence.
| Signal | Finding | Source |
|---|---|---|
| Company and ownership | Since the inception of our company, our mission has been simple: Make it easy for everyone to visualize data on the web. Over the years, web technology (HTML & JavaScript) has become incorporated into everything from sma | source |
| Contact and support | Contact us: Contact Page | source |
| Legal and privacy | Please see our Privacy Policy for details on how we use cookies, and why. | source |
| Security and compliance | Not published on the collected pages. | — |
| Uptime and status page | Not published on the collected pages. | — |
| Domain registered | 2009-10-27 | — |
| Domain expires | 2027-10-27 | — |
Not found on the collected pages: security and compliance, uptime and status page. This only means Scout did not find it on the pages it read; it says nothing about the company itself.
Documentation and product updates
Help resources, product guidance, and visible changes over time.
| Resource or update | Type | What is available | Date or freshness |
|---|---|---|---|
| Highcharts Documentation / Highcharts | Documentation | Find starting points for creating charts and dashboards, learning about Grid, and answering common questions, with links to product demos and API references for options and functions. (source) | Not dated |
| Creating custom Highcharts packages / Highcharts | Documentation | Create a custom Highcharts package by selecting ES modules in a master file. Build JavaScript bundles and optional declarations, then load the resulting package in a web page. (source) | Not dated |
| Price / Highcharts | Documentation | Fetch price time-series data under the account's market-data entitlement by setting the Price series type on TimeSeriesConnector; when requesting several securities, the first one determines the start date. (source) | Not dated |
| Accessibility module feature overview / Highcharts | Documentation | Learn how Highcharts supports keyboard navigation, screen readers, voice input, and low vision, with examples of accessible chart interactions, tactile export, audio charts, and translation options. (source) | Not dated |
| Annotations GUI / Highcharts | Documentation | Build a custom interface for chart annotations by binding HTML buttons to annotation actions. Follow an example that opens a dialog and saves changes to an annotation's fill color. (source) | Not dated |
| Annotations module / Highcharts | Documentation | Add labels and shapes to charts with the Annotations module. Learn how to position them using pixel or axis coordinates, share options, and define markers for annotation paths. (source) | Not dated |
| Boost module / Highcharts | Documentation | Set up WebGL rendering for large datasets with the Boost module. Learn how to configure data and activation thresholds, understand feature limitations, and measure rendering performance with built-in timing probes. (source) | Not dated |
| Breadcrumbs / Highcharts | Documentation | Configure navigation back through drilldown or hierarchical chart levels, choose whether to show the full path, and learn how to create breadcrumbs as a standalone element using their API. (source) | Not dated |
Not found in the collected public sources: public roadmap, changelog or release notes, status page, separate help center or knowledge base.
Technical
Technical and delivery signals
Delivery model, platforms, API, data ownership, reliability claims and release activity.
| Signal | Finding | Source |
|---|---|---|
| Delivery model (cloud, self-hosted, desktop, browser extension) | Highcharts is a JavaScript library that can be self-hosted or used in web apps S165. | S165 |
| Platforms and apps | Supports web and mobile platforms S169. | S169 |
| API and extensibility (API, SDK, webhooks, MCP, plugins) | Provides API references for options and functions S1. | S1 |
| Data ownership and export | Users can download source code and make edits S165. | S165 |
| Performance and reliability claims | Boost module enables WebGL rendering for large datasets S83. | S83 |
| Release activity | Not published on the collected pages. | — |
Measured infrastructure
Domain, certificate, and hosting signals, measured directly.
| Signal | Finding |
|---|---|
| Domain registered | 2009-10-27 — Domeneshop AS dba domainnameshop.com |
| Domain expires | 2027-10-27 |
| First archived | 2009-11-30 — web archive |
| TLS certificate | Google Trust Services, valid, expires 2026-12-10 |
| Security headers | HSTS, CSP, X-Content-Type-Options, X-Frame-Options, Referrer-Policy |
| Server header | cloudflare |
| Mail handled by | mx03.domeneshop.no, mx04.domeneshop.no |
| Nameservers | fred.ns.cloudflare.com, lisa.ns.cloudflare.com |
Not measurable: rdap: exceeded the overall budget; wayback: exceeded the overall budget; tls: exceeded the overall budget; dns: exceeded the overall budget; headers: exceeded the overall budget. A gap here means the lookup was unavailable, not that the finding is negative.
Technical site audit
A bounded multi-page crawl with page-level issues and URLs.
Scout — Bounded technical crawl
- Pages crawled: 15 of 15 maximum
- Technical health: 91/100
- Critical issues: 0
- Warnings: 26
- Notices: 5
Issues
| Severity | Issue | Value | Affected URL |
|---|---|---|---|
| warning | Title length should be reviewed | 101 | https://www.highcharts.com/ |
| warning | Title length should be reviewed | 101 | https://www.highcharts.com/ |
| warning | Title length should be reviewed | 67 | https://www.highcharts.com/products/ |
| notice | Meta description length should be reviewed | 183 | https://www.highcharts.com/demo |
| warning | Page should have one primary H1 | 2 | https://www.highcharts.com/demo |
| warning | Missing canonical URL | — | https://www.highcharts.com/demo |
| notice | Meta description length should be reviewed | 265 | https://www.highcharts.com/support/ |
| warning | Title length should be reviewed | 9 | https://www.highcharts.com/resources/ |
| notice | Meta description length should be reviewed | 1551 | https://www.highcharts.com/resources/ |
| warning | Title length should be reviewed | 9 | https://www.highcharts.com/blog/home/ |
| warning | Missing meta description | — | https://www.highcharts.com/blog/home/ |
| warning | Missing canonical URL | — | https://www.highcharts.com/blog/home/ |
| notice | Meta description length should be reviewed | 236 | <https://www.highcharts.com/chat/AI model/> |
| warning | Title length should be reviewed | 75 | https://www.highcharts.com/download/ |
| warning | Title length should be reviewed | 75 | https://www.highcharts.com/blog/download/ |
| warning | Missing meta description | — | https://www.highcharts.com/docs/ |
| warning | Page should have one primary H1 | 0 | https://www.highcharts.com/docs/ |
| warning | Missing canonical URL | — | https://www.highcharts.com/docs/ |
| notice | Low visible word count | 10 | https://www.highcharts.com/docs/ |
| warning | Title length should be reviewed | 78 | https://www.highcharts.com/integrations/all/ |
| warning | Title length should be reviewed | 69 | https://www.highcharts.com/integrations/react/ |
| warning | Title length should be reviewed | 74 | https://www.highcharts.com/integrations/typescript/ |
| warning | Title length should be reviewed | 152 | https://www.highcharts.com/integrations/javascript/ |
| warning | Duplicate title in audit sample | 2 | https://www.highcharts.com/ |
| warning | Duplicate title in audit sample | 2 | https://www.highcharts.com/ |
| warning | Duplicate title in audit sample | 2 | https://www.highcharts.com/download/ |
| warning | Duplicate title in audit sample | 2 | https://www.highcharts.com/blog/download/ |
| warning | Duplicate meta description in audit sample | 2 | https://www.highcharts.com/ |
| warning | Duplicate meta description in audit sample | 2 | https://www.highcharts.com/ |
| warning | Duplicate meta description in audit sample | 2 | https://www.highcharts.com/download/ |
| warning | Duplicate meta description in audit sample | 2 | https://www.highcharts.com/blog/download/ |
Crawled pages
| Status | Title | H1s | Words | Response | URL |
|---|---|---|---|---|---|
| 200 | JavaScript charting library for web apps, dashboards, grids, React and more \ | Highcharts \ | Highcharts | 1 | 776 |
| 200 | JavaScript charting library for web apps, dashboards, grids, React and more \ | Highcharts \ | Highcharts | 1 | 776 |
| 200 | Highcharts products \ | Features, downloads, and pricing \ | Highcharts | 1 | 824 |
| 200 | Highcharts Demos and Examples \ | Highcharts | 2 | 394 | 38 ms |
| 200 | Highcharts Support \ | Highcharts | 1 | 1564 | 33 ms |
| 200 | Resources | 1 | 451 | 162 ms | https://www.highcharts.com/resources/ |
| 200 | Blog Home | 1 | 514 | 21 ms | https://www.highcharts.com/blog/home/ |
| 200 | Highcharts Assist - Charting Powered by AI \ | Highcharts | 1 | 237 | 14 ms |
| 200 | Download Highcharts \ | JavaScript charting library and packages \ | Highcharts | 1 | 1761 |
| 200 | Download Highcharts \ | JavaScript charting library and packages \ | Highcharts | 1 | 1761 |
| 200 | Highcharts Documentation | 0 | 10 | 13 ms | https://www.highcharts.com/docs/ |
| 200 | Highcharts integrations for React, Angular, Vue, Python, and more \ | Highcharts | 1 | 462 | 22 ms |
| 200 | Highcharts for React \ | Official integration and examples \ | Highcharts | 1 | 985 |
| 200 | Highcharts for TypeScript \ | Official integration and examples \ | Highcharts | 1 | 923 |
| 200 | Use Highcharts to add interactive charts to Flutter apps. Includes setup, examples, and common patterns for interactive, accessible charts. \ | Highcharts | 1 | 929 | 183 ms |
This is a bounded Scout crawl. Core Web Vitals and Lighthouse scores are not claimed unless a dedicated performance audit is connected.
Search Console and Analytics
First-party search and behavioral data connection state.
Modeled acquisition channels
| Channel | Estimated share |
|---|---|
| direct | 45.3% |
| search | 39.1% |
| search organic | 35.6% |
| search paid | 3.5% |
| social | 2.8% |
| social organic | 2.6% |
| social paid | 0.2% |
| referrals | 11.4% |
| paid referrals | 0.4% |
| 0.3% | |
| gen ai | 0.7% |
| affiliate | 0.0% |
| other | 0.0% |
First-party connections
| Integration | Status | Data available after connection |
|---|---|---|
| Google Search Console | Not connected | Clicks, impressions, CTR, average position, queries, pages, countries, and devices |
| Google Analytics | Not connected | Organic sessions, engagement, landing pages, conversions, geography, and devices |
No first-party Search Console or Analytics numbers are shown until the site owner authorizes the corresponding Google account. Scout traffic model values above are modeled estimates, not private analytics totals.
Limits and method
Limitations and open questions
Known constraints and missing evidence from the collected pages.
The collected pages do not mention specific competitors. Evidence gaps include lack of detailed customer reviews, uptime status, and security certifications. Open questions remain about the free trial length and specific performance benchmarks.
Sources, method, and limitations
Evidence inventory, collection method, provider use, and constraints.
This report is based on 15 collected pages from highcharts.com, including documentation, product pages, and the shop pricing page. Static and browser rendering providers were used; external proof search was enabled but only discovered a G2 review profile. Limitations: some pages were cookie consent or navigation fragments, and pricing was taken from an authoritative shop page.
- Documentationhttps://www.highcharts.com/Verified
- Official Websitehttps://www.highcharts.com/blog/about/Verified
- Pricing Pagehttps://www.highcharts.com/blog/products/Verified
- Documentationhttps://www.highcharts.com/blog/products/grid/Verified
- Official Websitehttps://www.highcharts.com/blog/products/maps/Verified
- Documentationhttps://www.highcharts.com/docs/indexVerified
- Pricing Pagehttps://www.highcharts.com/docs/getting-started/how-to-create-custom-highcharts-packagesVerified
- Pricing Pagehttps://www.highcharts.com/docs/morningstar/time-series/priceVerified
- Official Websitehttps://www.highcharts.com/blog/posts/product-updates/Verified
- Official Websitehttps://www.highcharts.com/docs/accessibility/accessibility-module-feature-overviewVerified
- Official Websitehttps://www.highcharts.com/docs/advanced-chart-features/annotations-guiVerified
- Official Websitehttps://www.highcharts.com/docs/advanced-chart-features/annotations-moduleVerified
- Official Websitehttps://www.highcharts.com/docs/advanced-chart-features/boost-moduleVerified
- Official Websitehttps://www.highcharts.com/docs/advanced-chart-features/breadcrumbsVerified
- Official Websitehttps://www.highcharts.com/docs/advanced-chart-features/creating-advanced-annotationsVerified
- Articlehttps://www.highcharts.com/blog/use-cases/how-github-leverages-highcharts-to-visualize-development-activity/Verified
- Articlehttps://www.highcharts.com/blog/use-cases/drivetrain-and-highcharts-enabling-better-business-decisions/Verified
- Articlehttps://www.highcharts.com/blog/use-cases/horus-and-highcharts-democratizing-data/Verified
- Articlehttps://www.highcharts.com/blog/news/16-campaign-monitor-endorses-highcharts/Verified
- Articlehttps://www.highcharts.com/blog/use-cases/testmo/Verified
- Articlehttps://www.highcharts.com/blog/use-cases/scaling-an-agricultural-data-platform-farmables-frontend-redesign-with-highcharts/Verified
- Articlehttps://www.highcharts.com/blog/post/how-veezoo-turns-questions-into-visual-answers-with-highcharts/Verified
- Articlehttps://www.highcharts.com/blog/use-cases/the-guardian/Verified
- Articlehttps://www.highcharts.com/blog/use-cases/blackboard-ally-and-highcharts-working-together-to-improve-accessibility-in-higher-education/Verified
- Articlehttps://www.highcharts.com/industry/finance/Verified