In simple English
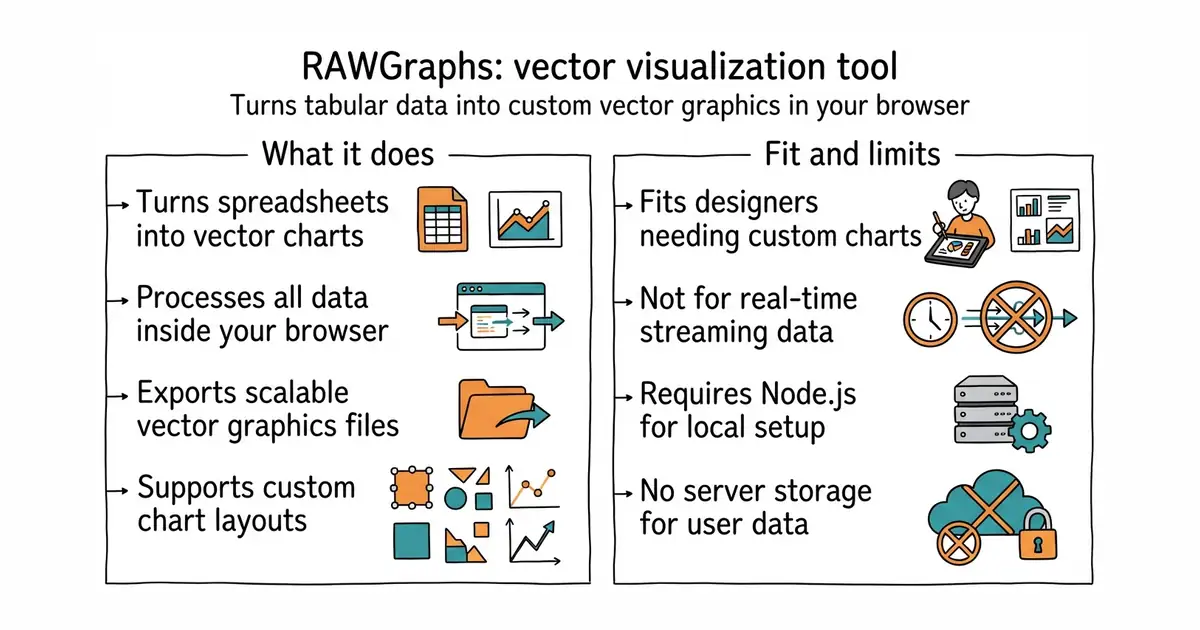
This tool turns numbers from a spreadsheet into custom vector graphics. You paste your table into the web page and pick a chart type. The app draws your chart right inside your web browser. No data leaves your computer, so your information stays private. You can download the finished chart as a scalable vector graphic (a picture made of math shapes that stays sharp at any size) to edit in other design programs.
What it is
RAWGraphs is an open-source web application for data visualization built on top of the D3.js (a JavaScript library for producing dynamic, interactive data visualizations in web browsers) library. It acts as a bridge between a spreadsheet app and a vector editor.
What it is good for
Designers and researchers who need to create custom charts from tabular data and want full control over the visual style without writing code.
- Runs entirely in your browser so your data never touches a remote server.
- Exports charts as clean vector graphics ready for design software.
- Includes many built-in chart layouts and accepts custom layouts.
- Requires Node.js (a tool that lets you run JavaScript outside of a web browser) and command-line steps to run locally.
- Large datasets can slow down the browser interface during rendering.
- No built-in database support, so you must paste or upload files manually every time.
Manual chart creation in design software or basic spreadsheet charts
Inkscape
- observablehq/plot5.4k stars
A JavaScript library for exploratory data visualization designed for concise code.

- GoogleChromeLabs/squoosh26k stars
A web page that compresses images in the browser and shows you the result before you save it.
- simple-icons/simple-icons26k stars
More than 3,400 brand logos as single-colour SVG files, released into the public domain.
- phosphor-icons/core394 stars
The raw SVG files and the catalogue for the Phosphor icon family, with no framework package attached.
git clone https://github.com/rawgraphs/rawgraphs-app.git
cd rawgraphs-app
npm install
npm start