In simple English
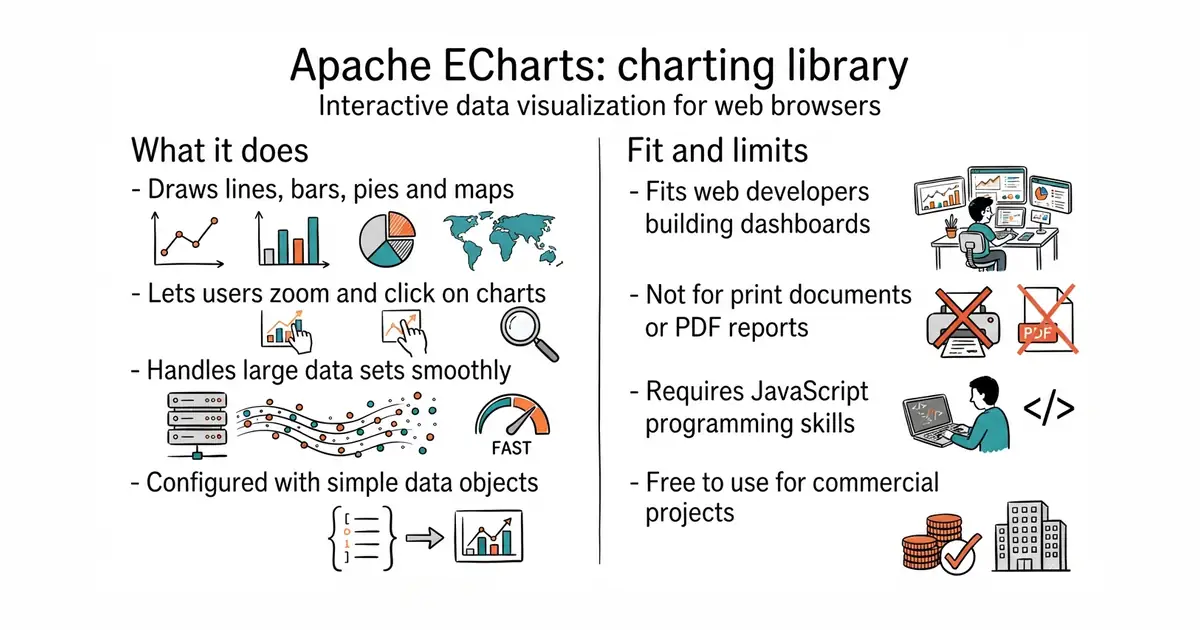
This library lets you draw charts on your web page. You feed it data and settings, and it creates a graph. Your users can click, hover and zoom on the final chart. It costs nothing to use in your commercial projects. You need some basic web programming knowledge to set it up.
What it is
Apache ECharts is a charting and data visualization library written in TypeScript (a programming language that adds safety rules to JavaScript). It runs inside web browsers using a rendering engine called zrender.
What it is good for
Solo builders who need to display data dashboards, analytics or charts in a web application without paying for a commercial graphing tool.
- Draws many chart types like lines, bars, pies and maps out of the box.
- Handles large amounts of data smoothly in the browser.
- Free to use under an open-source licence.
- Requires writing JavaScript or TypeScript code to configure every chart.
- The large set of configuration options can take time to learn.
- Large bundles can increase your web page download size if not imported carefully.
Building custom canvas graphs by hand or paying for commercial dashboard widget libraries.
Used alongside web frameworks like Vue or React to render dashboards.
- d3/d3114k stars
A lower-level graphics library that gives you total control over every pixel on the screen.


- GoogleChromeLabs/squoosh26k stars
A web page that compresses images in the browser and shows you the result before you save it.
- simple-icons/simple-icons26k stars
More than 3,400 brand logos as single-colour SVG files, released into the public domain.
- phosphor-icons/core394 stars
The raw SVG files and the catalogue for the Phosphor icon family, with no framework package attached.
npm install echarts --save