In simple English
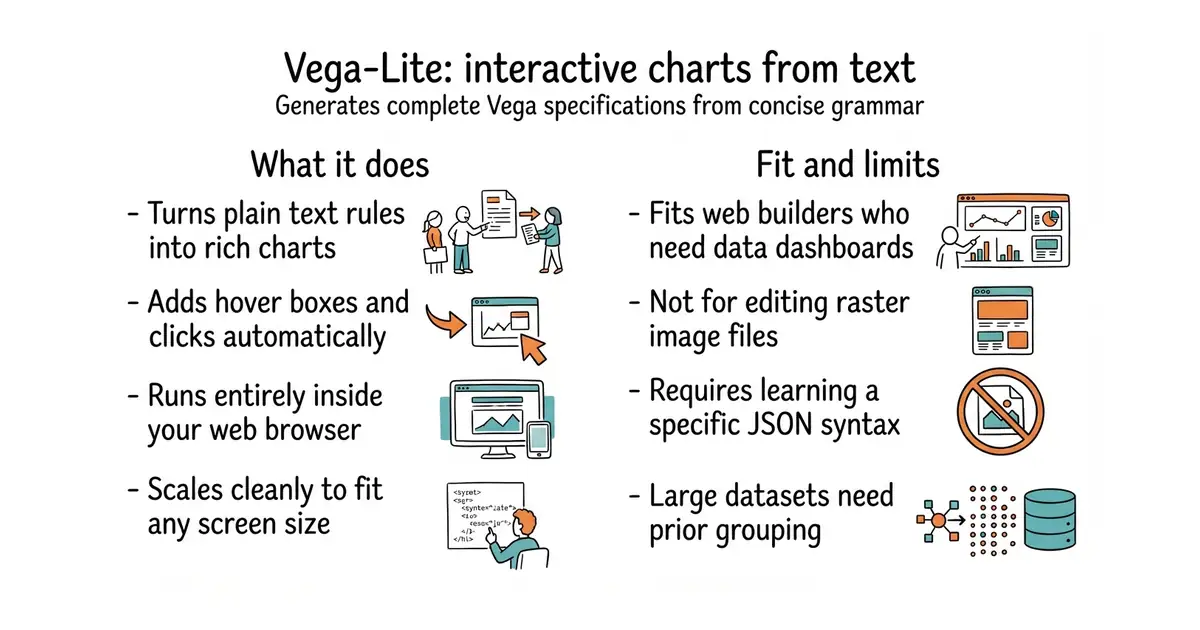
This tool helps you draw charts and graphs by writing plain text instructions instead of writing complex drawing code. You describe what data to show and how to group it. The tool builds the chart for you and adds mouse clicks and hover boxes. It costs nothing to use and runs entirely in your web browser. You do not need to install heavy graphics software on your server.
What it is
Vega-Lite is a high-level grammar for visual analysis that generates complete Vega (a visualization grammar, which is a system of rules for describing how data looks on a screen) specifications. It lets you build interactive charts using concise configuration files written in JSON (a plain text format for storing and sharing data).
What it is good for
Solo builders who want to add data dashboards or interactive reports to a web application without learning low-level canvas or SVG drawing libraries.
- Creates rich interactive charts from short text rules.
- Runs in any web browser without needing a backend server.
- Produces accessible graphics that scale cleanly to any screen size.
- Requires learning a specific JSON syntax to describe your charts.
- Customizing deep layout details can be harder than using direct drawing libraries.
- Large datasets can slow down browser rendering if not aggregated first.
Writing custom SVG drawing code or heavy charting libraries by hand.
Vega
- chartjs/Chart.js68k stars
Simple JavaScript charting library with imperative configuration instead of declarative grammar.


- GoogleChromeLabs/squoosh26k stars
A web page that compresses images in the browser and shows you the result before you save it.
- simple-icons/simple-icons26k stars
More than 3,400 brand logos as single-colour SVG files, released into the public domain.
- phosphor-icons/core394 stars
The raw SVG files and the catalogue for the Phosphor icon family, with no framework package attached.
npm install vega-lite vega embed