Overview
Summary
The useful answer before the supporting detail.
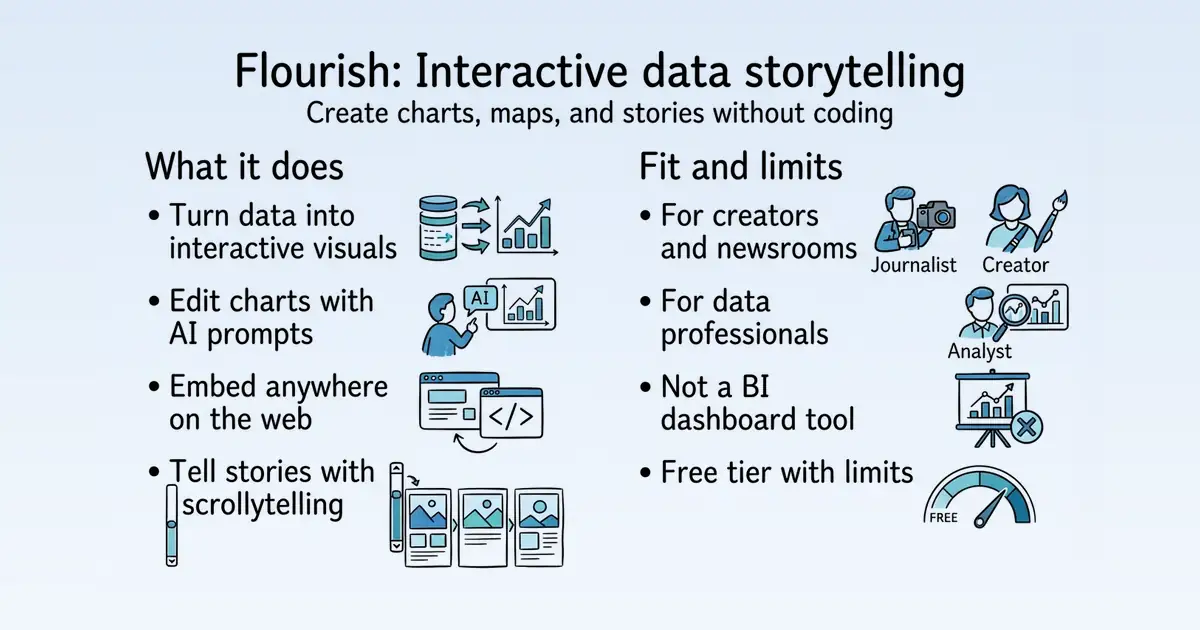
Flourish is a web-based data visualization platform that enables users to create interactive charts, maps, and stories without coding S30. It is used by creators, newsrooms, and enterprises to transform data into engaging narratives for websites, presentations, and reports S1 S122. The platform offers a free tier, AI-powered assistance, and flexible embedding options, making it accessible for both beginners and professionals S30 S122.
Product identity and positioning
Name, category, positioning, audience, and first-party claims.
- Identity: Flourish is a data visualization and storytelling platform S30.
- Core purpose: It enables non-coders to create high-end visualizations and stories without commissioning bespoke projects S1.
- Intended users: Creators, data professionals, newsrooms, and enterprises S1 S122.
- Product scope: A web-based platform offering templates for charts, maps, and interactive stories, plus AI tools S30.
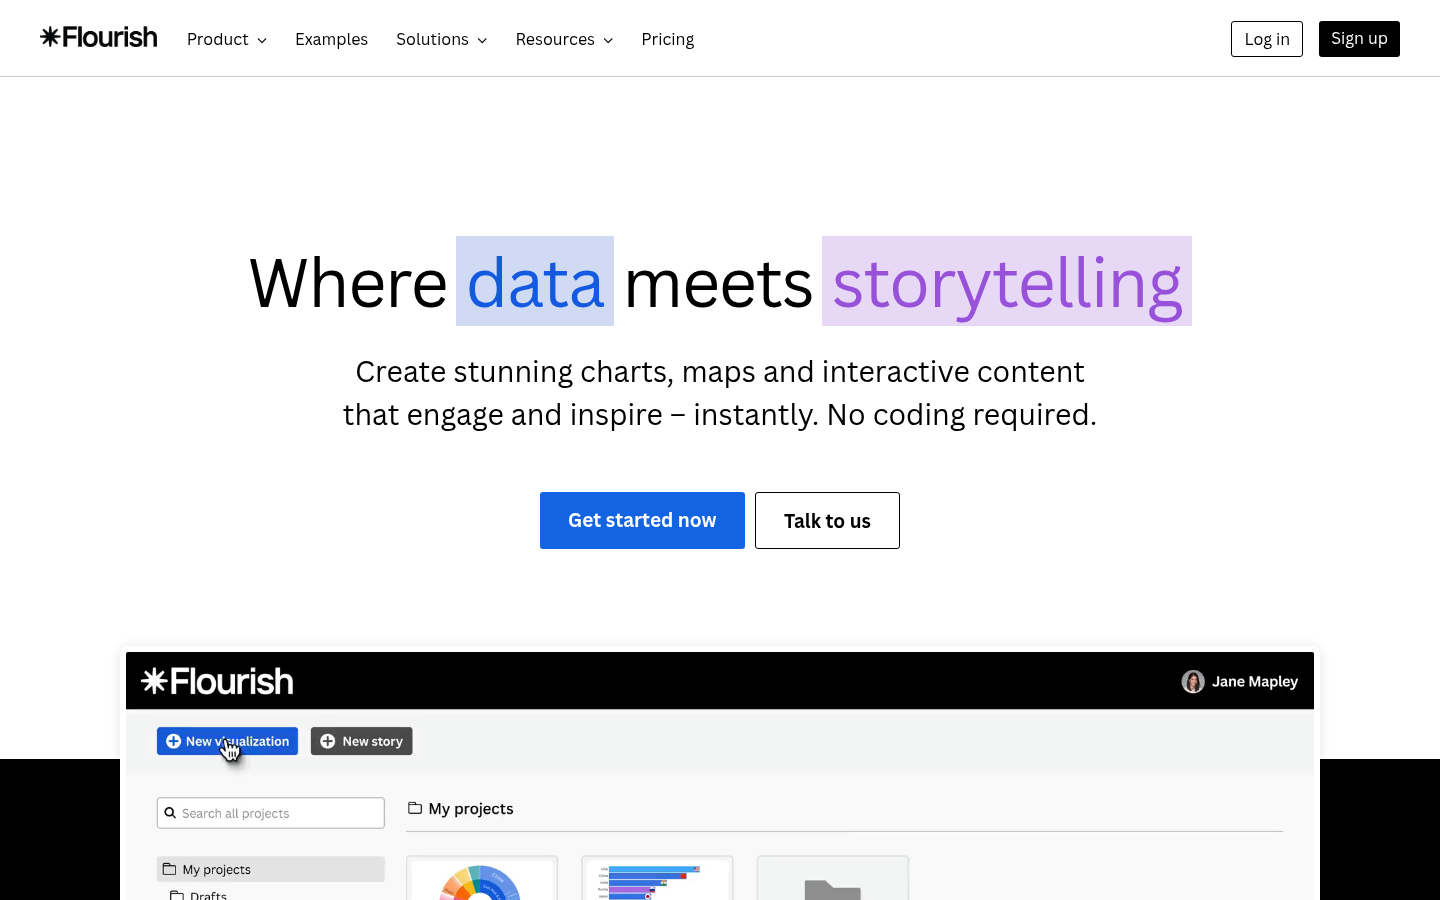
- Positioning: Flourish positions itself as an intuitive tool for telling stories with data S1.
- Claimed distinction: It is uniquely designed for narrative visualizations like scrollytelling and interactive presentations S122.
Use cases and audiences
Who the product serves and the jobs it is designed to handle.
| Audience | Practical use case |
|---|---|
| Newsrooms | Create interactive visuals for articles and reports S122. |
| Financial services | Break free from static assets and PDFs with dynamic storytelling S166. |
| Government | Turn complex data into clear, impactful stories quickly S167. |
| Nonprofits | Use data storytelling for advocacy and reporting S168. |
| Educators | Go beyond basics by adding filters and customizing layouts S165. |
Traffic and search
SEO analysis
Collected Oct 22, 2026flourish.studio: an estimated 1,006,411 total monthly visits and about 112,778 monthly organic visits across 8,427 ranking keywords. Scout crawled 15 pages and measured a technical health score of 98/100.
Search summary
The useful answer before the supporting detail.
Bring data to life with Flourish. Create data visualizations and interactive content – no coding needed. flourish.studio: an estimated 1,006,411 total monthly visits and about 112,778 monthly organic visits across 8,427 ranking keywords. Scout crawled 15 pages and measured a technical health score of 98/100.
- Total traffic (modeled): 1,006,411 monthly visits across all channels.
- Organic search traffic (estimated): 112,778 monthly visits from search.
- Strongest sampled ranking: bar chart race at position 1.
- Leading page in the collected evidence: https://flourish.studio/visualisations/bar-chart-race/.
- Closest measured organic competitor: youtube.com, appearing 2 times in the sampled first-page SERPs.
- Technical crawl: 15 pages, health score 98/100.
Website intelligence — Collected evidence
Company identity and positioning
| Page type | Evidence | Source |
|---|---|---|
| other | Bring data to life with Flourish. Create data visualizations and interactive content – no coding needed. Engage, inspire, and tell your best data stories with ease. | https://flourish.studio/ |
| other | Team up, stay on brand | https://flourish.studio/ |
| other | Simplify collaboration and ensure your visuals stay polished and on-brand. Advanced sharing and customization options let your team create with confidence. | https://flourish.studio/ |
| other | Flourish for Financial ServicesProfessional ServicesNewsroomsMarketingNonprofitsEducationGovernment | https://flourish.studio/ |
| other | > Flourish support is great: accessible, friendly, pursuing solutions for our eternal ‘exception of the rules’ queries to make visualizations work in our 40 languages.” | https://flourish.studio/ |
| other | Ready to transform your work with data storytelling? Connect with our team to learn more and get started today! | https://flourish.studio/ |
| other | Flourish is a powerful data visualization platform that empowers the world to tell stories with data. Trusted by organizations and newsrooms worldwide, Flourish helps creators bring data narratives to life with highly engaging, interactive and impressive visualizations. Our extensive library of templates and seamless embedding options make every data story informative and truly captivating. | https://flourish.studio/ |
| other | Storytelling: Flourish is uniquely designed to facilitate narrative visualizations, such as scrollytelling, interactive presentations, and audio-driven stories. | https://flourish.studio/ |
| other | Publishability: All outputs are styled for robustness, capable of reaching unlimited audiences, and optimized for mobile viewing. | https://flourish.studio/ |
| other | Flourish is not typically regarded as a business intelligence tool. While its templates and API allow for data exploration and dashboard integration, its primary focus is on data storytelling, especially for presentations and digital publications. | https://flourish.studio/ |
| other | Nonprofits | https://flourish.studio/ |
| other | Help docs | https://flourish.studio/ |
Domain performance
Modeled total traffic, six-month trend, engagement, countries, and domain identity.
Total website traffic
| Month | Modeled visits |
|---|---|
| 2026-04 | 1,203,058 |
| 2026-05 | 1,209,426 |
| 2026-06 | 1,117,760 |
| 2026-07 | 1,100,034 |
| 2026-08 | 1,060,762 |
| 2026-09 | 1,006,411 |
Top visitor countries
| Country | Name | Traffic share |
|---|---|---|
| US | United States | 28.8% |
| GB | United Kingdom | 8.3% |
| FR | France | 5.6% |
| AU | Australia | 3.1% |
| DK | Denmark | 2.8% |
Domain identity
| Signal | Value |
|---|---|
| Registered | May 18, 2016 |
| Last changed | Sep 29, 2026 |
| Expires | May 18, 2028 |
| WHOIS server | — |
| DNSSEC | Not signed |
| Nameservers | ns-1257.awsdns-29.org, ns-1905.awsdns-46.co.uk, ns-882.awsdns-46.net, ns-351.awsdns-43.com |
Website capture
Organic keywords
Top keywords and an independent Google result page.
Top organic keywords
| Keyword | Volume | CPC | Estimated value |
|---|---|---|---|
| flourish | 95,480 | $2.62 | $48,510 |
| flourish studio | 2,210 | $3.31 | $700 |
| florish | 2,980 | $2.00 | $690 |
| fortune 500 ceos | 19,170 | $0.00 | $680 |
| fluorish | 1,220 | $4.38 | $680 |
Independent Google result page
Query: bar chart race
| Position | Title | URL | Description |
|---|---|---|---|
| 1 | Make a bar chart race without coding | https://flourish.studio/visualisations/bar-chart-race/ | With Flourish, you can create bar chart races in minutes — no coding needed. Upload your data, customize colors and fonts, add captions or images, and share ... |
| 2 | Bar Chart Race Maker | Create Animated Data Visualizations | https://livingcharts.com/ | A bar chart race is a type of data visualization that shows changes in the relative sizes of categories over time through a dynamic animation. It consists of a ... |
| 3 | Bar chart race – an overview | https://helpcenter.flourish.studio/hc/en-us/articles/8761566757647-Bar-chart-race-an-overview | Our bar chart race template is perfect for visualizing the changing fortunes of people or groups in competition with each other, like political ... |
| 4 | Bar Chart Race, Explained | D3 | https://observablehq.com/@d3/bar-chart-race-explained | The data for the race is a CSV with columns date (in YYYY-MM-DD format), name, value and optionally category (which if present determines color). |
| 5 | Bar Chart Race App | https://barchartrace.graphtochart.com/ | Generate your own bar chart race online from a csv file(excel) for free. Find out more about 1300 bar chart race, including population, GDP, density, ... |
| 6 | How to Make a Bar Chart Race Animation with Python | https://www.youtube.com/watch?v=lptnMUJ3jVs | In this fun episode, we're going to take a first run at making a bar chart race with Python. You know those cool bar charts you see all over ... |
| 7 | Bar Chart Race Maker - Apps on Google Play | https://play.google.com/store/apps/details?id=info.camposha.bar_chart_race&hl=en_US | A free, offline, multi-language app to create Bar chart race videos. Turn raw numbers into mesmerizing animated bar chart races videos — the ... |
| 8 | Free Bar Graph Maker - Create Bar Chart Race Online | https://www.canva.com/graphs/bar-graphs/ | Compare data with custom bar graphs or interactive bar chart race with Canva's free bar graph creator online. |
| 9 | Thoughts on bar chart races? : r/dataanalysis | https://www.reddit.com/r/dataanalysis/comments/1s2btg3/thoughts_on_bar_chart_races/ | While they are visually appealing, I find bar chart races often obscure the actual data trends. It is difficult to compare specific values or ... |
Important pages
Pages earning the most estimated search traffic in the sample.
| URL | Ranking keywords | Estimated traffic | Best position |
|---|---|---|---|
| https://flourish.studio/visualisations/bar-chart-race/ | 10 | 453 | 1 |
| https://flourish.studio/blog/animated-charts/ | 4 | 149 | 1 |
| https://flourish.studio/blog/bar-vs-line-graph/ | 1 | 118.6 | 1 |
| https://flourish.studio/visualisations/line-bar-pie-charts/ | 1 | 63.8 | 1 |
| https://flourish.studio/ | 2 | 48.6 | 1 |
| https://public.flourish.studio/visualisation/7799365/ | 1 | 12.2 | 1 |
| https://flourish.studio/visualisations/gauge-charts/ | 1 | 6.1 | 1 |
Website intelligence — Collected evidence
Prioritized website intelligence pages
| Type | Page | Words | Change | URL |
|---|---|---|---|---|
| other | Flourish | 905 | new | https://flourish.studio/ |
| pricing | Pricing \ | static | 1,205 | new |
| features | Flourish Assistant \ | playwright | 902 | new |
| features | Transform data into stories \ | static | 1,059 | new |
| features | Effortless data visualization \ | static | 1,170 | new |
| features | Create interactive content \ | playwright | 899 | new |
| features | Flourish Connector \ | static | 1,060 | new |
| features | Education \ | static | 555 | new |
| features | Financial Services \ | static | 552 | new |
| features | Government \ | static | 574 | new |
| features | Marketing \ | static | 591 | new |
| features | Newsrooms \ | static | 557 | new |
| features | Nonprofits \ | static | 759 | new |
| features | Professional Services \ | static | 545 | new |
| integrations | Build in Flourish, present in PowerPoint \ | static | 750 | new |
Features
| Page type | Evidence | Source |
|---|---|---|
| features | Flourish logo | https://flourish.studio/product/ai-assistant/ |
| features | Flourish Assistant | https://flourish.studio/product/ai-assistant/ |
| features | AI-powered guidance to help you refine your visualizations as you create – in plain language, with every change in your control. | https://flourish.studio/product/ai-assistant/ |
| features | ](https://app.flourish.studio/templates) | https://flourish.studio/product/ai-assistant/ |
| features | Available on all plans. [Learn more →](#ai-demo) | https://flourish.studio/product/ai-assistant/ |
| features | Data visualization, refined with AI | https://flourish.studio/product/ai-assistant/ |
| features | Go from good chart to a great story in a few prompts. Ask for edits, a final check, or a clearer way to tell the story. Flourish Assistant helps you refine the details, sharpen the message, and stay in control of every change. | https://flourish.studio/product/ai-assistant/ |
| features | Stay in control | https://flourish.studio/product/ai-assistant/ |
| features | Your data, your judgment and your final chart stay in your hands. The Assistant shows you every change it suggests, and every edit is something you can see and undo. | https://flourish.studio/product/ai-assistant/ |
| features | Make edits faster | https://flourish.studio/product/ai-assistant/ |
| features | Skip the settings search. Ask the Assistant to handle styling, layout and polish, and get to a finished chart faster. | https://flourish.studio/product/ai-assistant/ |
| features | Bring in best practice | https://flourish.studio/product/ai-assistant/ |
| features | Find ways to highlight what matters, sharpen the story and improve clarity — with every suggestion grounded in data visualization best practice. | https://flourish.studio/product/ai-assistant/ |
| features | See what the Assistant can do | https://flourish.studio/product/ai-assistant/ |
| features | Pick a prompt and watch it transform the chart | https://flourish.studio/product/ai-assistant/ |
| features | Use the key insight to write a strong headerSuggest a different chart layoutTransform to dark mode | https://flourish.studio/product/ai-assistant/ |
| features | For every skill level. For every team. | https://flourish.studio/product/ai-assistant/ |
| features | For those getting started | https://flourish.studio/product/ai-assistant/ |
| features | Create clearer charts while you learn. The Assistant helps you apply good data visualization practice as you go. | https://flourish.studio/product/ai-assistant/ |
| features | For data professionals | https://flourish.studio/product/ai-assistant/ |
Pricing and plans
| Page type | Evidence | Source |
|---|---|---|
| pricing | Available with a Canva Business or Enterprise plan. All in Free, plus: | https://flourish.studio/pricing/ |
| pricing | \ | Free |
| pricing | \ | \ |
| pricing | \ | \ |
| pricing | \ | \ |
| pricing | Select a plan to compare: FreePresenterPublisherEnterprise | https://flourish.studio/pricing/ |
| pricing | How does billing work? | https://flourish.studio/pricing/ |
| pricing | An exception is the Presenter plan, which is included with Canva for Business and billed directly via Canva. | https://flourish.studio/pricing/ |
| pricing | Flourish and Canva work hand in hand. If you’re on the Canva Business plan, you’ll find Flourish built right in – perfect for creating and embedding interactive charts directly in your Canva designs. | https://flourish.studio/pricing/ |
| pricing | Pricing | https://flourish.studio/pricing/ |
Integrations and supported platforms
| Page type | Evidence | Source |
|---|---|---|
| integrations | Flourish logo | https://flourish.studio/integrations/powerpoint/ |
| integrations | Build in Flourish, present in PowerPoint | https://flourish.studio/integrations/powerpoint/ |
| integrations | Bring interactive charts directly into your slides. Beautiful, animated, and fully responsive – ready to move at your pace. | https://flourish.studio/integrations/powerpoint/ |
| integrations | ](/pricing/) | https://flourish.studio/integrations/powerpoint/ |
| integrations | Static charts work. Until the real questions begin. | https://flourish.studio/integrations/powerpoint/ |
| integrations | With Flourish in PowerPoint, your slides turn into dynamic, interactive experiences. Explore the data live, filter on the fly, and respond in the moment - all without leaving your presentation. | https://flourish.studio/integrations/powerpoint/ |
| integrations | Interactive charts, | https://flourish.studio/integrations/powerpoint/ |
| integrations | right where you need them | https://flourish.studio/integrations/powerpoint/ |
| integrations | Swap your static presentations with interactive experiences. Flourish charts in PowerPoint stay explorable and responsive, so your audience can engage with the data in real time. | https://flourish.studio/integrations/powerpoint/ |
| integrations | Build once, use everywhere | https://flourish.studio/integrations/powerpoint/ |
| integrations | Spend less time updating charts and more time delivering insights. Update once in Flourish and your slides reflect the changes instantly – keeping your visuals current and ready to present. | https://flourish.studio/integrations/powerpoint/ |
| integrations | Stand out with every slide | https://flourish.studio/integrations/powerpoint/ |
| integrations | Create visuals that go the extra mile without the extra effort. With company themes and rich customization, every slide is polished, consistent, and boardroom-ready in seconds. | https://flourish.studio/integrations/powerpoint/ |
| integrations | Presentations that leave an impression | https://flourish.studio/integrations/powerpoint/ |
| integrations | Everything you need to make data visualization easy and beautiful | https://flourish.studio/integrations/powerpoint/ |
| integrations | Embed in seconds | https://flourish.studio/integrations/powerpoint/ |
| integrations | Add live Flourish visualizations to PowerPoint. No exporting, no screenshots. | https://flourish.studio/integrations/powerpoint/ |
| integrations | Stay interactive | https://flourish.studio/integrations/powerpoint/ |
| integrations | Hover, filter, and explore every angle of your data while you present. | https://flourish.studio/integrations/powerpoint/ |
| integrations | Instant updates | https://flourish.studio/integrations/powerpoint/ |
Product and company updates
No supporting public-page evidence was collected for this category.
Rank tracking
Persistent keyword baselines and position movement.
This analysis created the first position baseline at 2026-10-22T06:50:54.177Z. Movement appears after the next fresh analysis using the same location and language.
Features
Features and capabilities
Core functions and evidence-backed product capabilities.
| Capability | What it does |
|---|---|
| Template library | Choose from professionally designed templates for charts, maps, and stories S30. |
| AI Assistant | Edit visualizations using plain-language prompts within the editor S7. |
| AI Connector | Create and edit Flourish visualizations from AI tools like AI modeland ChatGPT via MCP S17. |
| Story formats | Build multi-slide presentations or scrollytelling experiences S24. |
| Interactivity | Add legends, filters, sliders, and other interactive elements without coding S38. |
| Embedding | Publish visualizations with responsive embed codes for any HTML-supported platform S30. |
| Data updates | Automatically update visualizations from publicly accessible CSV files at intervals S30. |
| Export options | Download visualizations as PNG, JPEG, SVG, or HTML S158. |
Integrations and ecosystem
Connected products, exports, APIs, and workflow compatibility.
| Integration or interface | Type | What it enables |
|---|---|---|
| Canva | Integration | Add interactive visualizations to Canva designs S38. |
| PowerPoint | Integration | Embed interactive visualizations in PowerPoint presentations S158. |
| AI model, ChatGPT | AI interface | Create and edit Flourish charts via MCP S17. |
| Live data connection | Data portability | Link to Google Sheets or public CSVs to auto-update charts S158. |
| API | API | Programmatically create, update, and manage visualizations S158. |
| SDK | SDK | Build and upload custom templates S122. |
| Analytics connector | Integration | Track events like clicks and story progression in analytics platforms S158. |
Pricing
Pricing and plans
Published plans, free access, trials, credits, and pricing limitations.
| Plan or offer | Verified price and billing | Included | Limits |
|---|---|---|---|
| Free | $0 S158 | Unlimited projects and stories, all templates, public publishing with attribution S158 | Starter Assistant allowance S158 |
| Presenter | Included with Canva Business or Enterprise, billed by Canva S158 | Charts in Canva and PowerPoint, image and SVG export S158 | Standard Assistant allowance S158 |
| Publisher | Contact sales S158 | Website embeds without attribution, scrollytelling, live data, HTML export S158 | Extended Assistant allowance S158 |
| Enterprise | Contact sales S158 | SSO, live rendering API, multiple custom themes, SLAs S158 | Maximum Assistant allowance S158 |
Competition
Competitive landscape
Domains competing for the same organic search demand.
Sampled competitors
| Competitor | First-page appearances | Sampled queries | Average position | Queries observed |
|---|---|---|---|---|
| youtube.com | 2 | 2 | 5 | bar chart race, bar line graphs |
| reddit.com | 2 | 2 | 5.5 | bar chart race, bar line graphs |
| highcharts.com | 1 | 1 | 1 | bar line graphs |
| livingcharts.com | 1 | 1 | 2 | bar chart race |
| mathsisfun.com | 1 | 1 | 2 | bar line graphs |
| helpcenter.flourish.studio | 1 | 1 | 3 | bar chart race |
| observablehq.com | 1 | 1 | 4 | bar chart race |
| barchartrace.graphtochart.com | 1 | 1 | 5 | bar chart race |
| math.libretexts.org | 1 | 1 | 5 | bar line graphs |
| mokkup.ai | 1 | 1 | 6 | bar line graphs |
Website intelligence — Collected evidence
Customers, testimonials, and first-party review claims
No supporting public-page evidence was collected for this category.
Independent review sources discovered
No links to supported independent review platforms were discovered on the collected pages.
Backlink profile
Authority and referring-domain signals.
Backlink comparison profile
- Domain rating: 86/100
- Backlinks: 2,805,375
- Referring domains: 26,507
- Dofollow backlinks: 56.0%
- Dofollow referring domains: 88.0%
Collection decision
The Scout search index remains intentionally excluded from automatic Scout analysis. This Scout traffic model profile costs 5 credits (0.5 cents) and is included in the first comparison run so its usefulness can be judged before the recurring collection is finalized.
AI visibility
Measured ChatGPT and Google AI mentions with cited sources.
AI-assistant referral traffic
- Estimated current generative-AI referral share: 1.8%
| Month | Traffic share | Source |
|---|---|---|
| — | — | All AI assistants |
| — | — | All AI assistants |
| — | — | All AI assistants |
Website intelligence — Collected evidence
Site-stated AI capabilities
| Page type | Evidence | Source |
|---|---|---|
| features | AI-powered guidance to help you refine your visualizations as you create – in plain language, with every change in your control. | https://flourish.studio/product/ai-assistant/ |
| features | AI-powered guidance to help you refine your visualizations as you create – in plain language, with every change in your control. | https://flourish.studio/product/ai-assistant/ |
| features | Available on all plans. [Learn more →](#ai-demo) | https://flourish.studio/product/ai-assistant/ |
| features | Data visualization, refined with AI | https://flourish.studio/product/ai-assistant/ |
These are first-party product claims, not independent measurements of AI-search visibility.
Marketing opportunities
Actions calculated directly from the collected evidence.
| Opportunity | Recommended action | Evidence |
|---|---|---|
| Competitor gap | Review the sampled queries where youtube.com appears. | 2 first-page appearances across bar chart race, bar line graphs |
Website intelligence — Collected evidence
Website evidence gaps
- customers: no usable public page was collected; verify whether the site publishes this evidence.
- reviews: no usable public page was collected; verify whether the site publishes this evidence.
- changes: no usable public page was collected; verify whether the site publishes this evidence.
- identity: no usable public page was collected; verify whether the site publishes this evidence.
- technical: no usable public page was collected; verify whether the site publishes this evidence.
Trust and proof
Customers, proof, and reviews
Published proof, customer signals, and review evidence.
Independent reviews
No citation-grounded independent review links were found.
Customer proof
| Proof type | Named customer or source | Evidence |
|---|---|---|
| Case study | Peiying Loh | customer case study — Kontinentalist is a Singapore-based and Asia-focused editorial studio that focuses on telling stories about the continent through data and design. (Unpacking Asia’s complex dynamics with data storytelling / Flourish) |
| Testimonial | Flourish Blog | testimonial — Flourish changed the old workflow immediately. (After 3,000+ charts, here’s why I trust Flourish for interactive data stories / Flourish) |
| Case study | Tortoise and Sky News | customer case study — Created with Flourish, the Westminster Accounts is the first fully searchable database of the money flowing into British politics. (How Tortoise & Sky News built a powerful data exploration tool with the Flourish SDK / Flourish) |
| Case study | Carmen Aguilar García and Edward Hollinghurst | customer case study — A couple of weeks ago, Sky News published a piece online about deaths from vaccine-preventable diseases . (How Sky News revealed Flourish’s secret scrollytelling feature / Flourish) |
| Case study | flourish.studio | customer case study — Finance Uncovered’s mission is to improve the quantity and quality of investigative stories that are rooted in illicit finance or exploitation by training and supporting journalists and activists around the world. (Improving investigative stories through interactive visualization / Flourish) |
Independent mentions
- Masters series: John Burn-Murdoch’s step-by-step animated line chart / Flourish — > At the FT we’ve shared hundreds of charts on the pandemic over the past 12 months, but this one has set records everywhere it has appeared. It has been seen by more than 10 million people on Twitter, broke records for us on Instagram and drew tens of thousands of responses on Reddit. It was especially nice seeing the number of people who specifically mentioned the use of animation as something they liked about it, and the number of people who got in touch with me directly on all sorts of platf
- Customer stories / Flourish — # How Tortoise & Sky News built a powerful data exploration tool with the Flourish SDK ## Learn how the two newsrooms used Flourish to create the Westminster Accounts, an innovative data exploration platform Posted on 16 June 2023 by Simona Tselova
- Flourish — in data journalism and publishing, while Robin is a mathematician and developer. In 2022, Canva acquired Flourish with the shared goal of democratizing data storytelling and making data visualization accessible to all. Read more about this here.
- Newsrooms / Flourish — With a small data team we're able to produce big and complex stories rich with interactive visualizations. Live API allowed us to fully automate visualization data workflow from data ingest, build through to realtime updates. Przemyslaw
- Data visualization examples / Flourish — Data visualization examples / Flourish company 08825531 33 Hoxton Square London N1 6NN
External links were grounded in one live web search. Search snippets are leads, not independently scraped page content; rejected links remain available in Review evidence.
Company, security, and trust
Ownership, policies, security signals, and public trust evidence.
| Signal | Finding | Source |
|---|---|---|
| Company and ownership | Ready to transform your work with data storytelling? Connect with our team to learn more and get started today! | source |
| Contact and support | Visit the help center → | source |
| Legal and privacy | Not published on the collected pages. | — |
| Security and compliance | SSO and password management policies | source |
| Uptime and status page | / SLA and MLAAccess Service Level and Master Service Agreements for compliance. / / / / / | source |
| Domain registered | 2016-05-18 | — |
| Domain expires | 2028-05-18 | — |
Not found on the collected pages: legal and privacy. This only means Scout did not find it on the pages it read; it says nothing about the company itself.
Documentation and product updates
Help resources, product guidance, and visible changes over time.
Not established in the collected sources.
Technical
Technical and delivery signals
Delivery model, platforms, API, data ownership, reliability claims and release activity.
| Signal | Finding | Source |
|---|---|---|
| Delivery model (cloud, self-hosted, desktop, browser extension) | Flourish is a web-based platform S30. | S30 |
| Platforms and apps | Available on web; also integrated into Canva S38. | S38 |
| API and extensibility (API, SDK, webhooks, MCP, plugins) | Offers API, SDK, and MCP connector S158 S122 S17. | S158 S122 S17 |
| Data ownership and export | Users can export visualizations as PNG, JPEG, SVG, or HTML S158. | S158 |
| Performance and reliability claims | Not published on the collected pages. | — |
| Release activity | Not published on the collected pages. | — |
Measured infrastructure
Domain, certificate, and hosting signals, measured directly.
| Signal | Finding |
|---|---|
| Domain registered | 2016-05-18 — Gandi SAS |
| Domain expires | 2028-05-18 |
| First archived | 2016-09-20 — web archive |
| TLS certificate | Amazon, valid, expires 2027-02-10 |
| Security headers | HSTS, CSP, X-Content-Type-Options, X-Frame-Options, Referrer-Policy |
| Server header | AmazonS3 |
| Mail handled by | mxa.mailgun.org, mxb.mailgun.org |
| Nameservers | ns-1257.awsdns-29.org, ns-1905.awsdns-46.co.uk |
Technical site audit
A bounded multi-page crawl with page-level issues and URLs.
Scout — Bounded technical crawl
- Pages crawled: 15 of 15 maximum
- Technical health: 98/100
- Critical issues: 0
- Warnings: 1
- Notices: 11
Issues
Crawled pages
| Status | Title | H1s | Words | Response | URL |
|---|---|---|---|---|---|
| 200 | Flourish | 1 | 836 | 23 ms | https://flourish.studio/ |
| 200 | Effortless data visualization \ | Flourish | 1 | 1176 | 286 ms |
| 200 | Transform data into stories \ | Flourish | 1 | 1061 | 291 ms |
| 200 | Create interactive content \ | Flourish | 1 | 893 | 193 ms |
| 200 | Flourish Assistant \ | Flourish | 1 | 914 | 294 ms |
| 200 | Flourish Connector \ | Flourish | 1 | 1071 | 424 ms |
| 200 | Data visualization examples \ | Flourish | 1 | 260 | 283 ms |
| 200 | Financial Services \ | Flourish | 1 | 592 | 285 ms |
| 200 | Professional Services \ | Flourish | 1 | 587 | 413 ms |
| 200 | Newsrooms \ | Flourish | 1 | 592 | 283 ms |
| 200 | Marketing \ | Flourish | 1 | 627 | 404 ms |
| 200 | Nonprofits \ | Flourish | 1 | 788 | 228 ms |
| 200 | Government \ | Flourish | 1 | 615 | 299 ms |
| 200 | Education \ | Flourish | 1 | 598 | 290 ms |
| 200 | Visualize elections \ | Flourish | 1 | 961 | 284 ms |
This is a bounded Scout crawl. Core Web Vitals and Lighthouse scores are not claimed unless a dedicated performance audit is connected.
Search Console and Analytics
First-party search and behavioral data connection state.
Modeled acquisition channels
| Channel | Estimated share |
|---|---|
| direct | 53.5% |
| search | 27.7% |
| search organic | 27.6% |
| search paid | 0.1% |
| social | 8.8% |
| social organic | 8.6% |
| social paid | 0.2% |
| referrals | 7.1% |
| paid referrals | 0.0% |
| 1.1% | |
| gen ai | 1.8% |
| affiliate | 0.0% |
| other | 0.0% |
First-party connections
| Integration | Status | Data available after connection |
|---|---|---|
| Google Search Console | Not connected | Clicks, impressions, CTR, average position, queries, pages, countries, and devices |
| Google Analytics | Not connected | Organic sessions, engagement, landing pages, conversions, geography, and devices |
No first-party Search Console or Analytics numbers are shown until the site owner authorizes the corresponding Google account. Scout traffic model values above are modeled estimates, not private analytics totals.
Limits and method
Limitations and open questions
Known constraints and missing evidence from the collected pages.
The collected pages do not mention specific competitors. Evidence gaps include lack of detailed pricing for Publisher and Enterprise plans, no explicit uptime or performance metrics, and no independent review ratings. Open questions remain about data retention policies for AI features and the full scope of enterprise security compliance.
Sources, method, and limitations
Evidence inventory, collection method, provider use, and constraints.
This report is based on 15 collected pages from flourish.studio, including product pages, pricing, and company information. Evidence was gathered via static and rendered page collection. External proof search was performed but no third-party reviews were scraped. Limitations include reliance on vendor-provided information and absence of independent verification of claims.
- Official Websitehttps://flourish.studio/Verified
- Official Websitehttps://flourish.studio/company/Verified
- Official Websitehttps://flourish.studio/product/ai-assistant/Verified
- Official Websitehttps://flourish.studio/product/mcp-connector/Verified
- Official Websitehttps://flourish.studio/product/data-storytelling/Verified
- Pricing Pagehttps://flourish.studio/pricing/Verified
- Official Websitehttps://flourish.studio/product/data-visualization/Verified
- Official Websitehttps://flourish.studio/product/interactive-content/Verified
- Official Websitehttps://flourish.studio/solutions/education/Verified
- Official Websitehttps://flourish.studio/solutions/financial-services/Verified
- Official Websitehttps://flourish.studio/solutions/government/Verified
- Official Websitehttps://flourish.studio/solutions/marketing/Verified
- Official Websitehttps://flourish.studio/solutions/newsrooms/Verified
- Official Websitehttps://flourish.studio/solutions/not-for-profit/Verified
- Official Websitehttps://flourish.studio/solutions/professional-services/Verified
- Articlehttps://flourish.studio/blog/kontinentalist-customer-story/Verified
- Articlehttps://flourish.studio/blog/best-data-visualization-tool-for-newsrooms/Verified
- Articlehttps://flourish.studio/blog/westminster-accounts/Verified
- Articlehttps://flourish.studio/blog/scrollytelling-flourish-sky-q-and-a/Verified
- Articlehttps://flourish.studio/blog/finance-uncovered-customer-story/Verified
- Articlehttps://flourish.studio/blog/masters-reveal-line-john-burn-murdoch/Verified
- Articlehttps://flourish.studio/blog/categories/customer-stories/Verified
- Articlehttps://flourish.studio/examples/Verified