In simple English
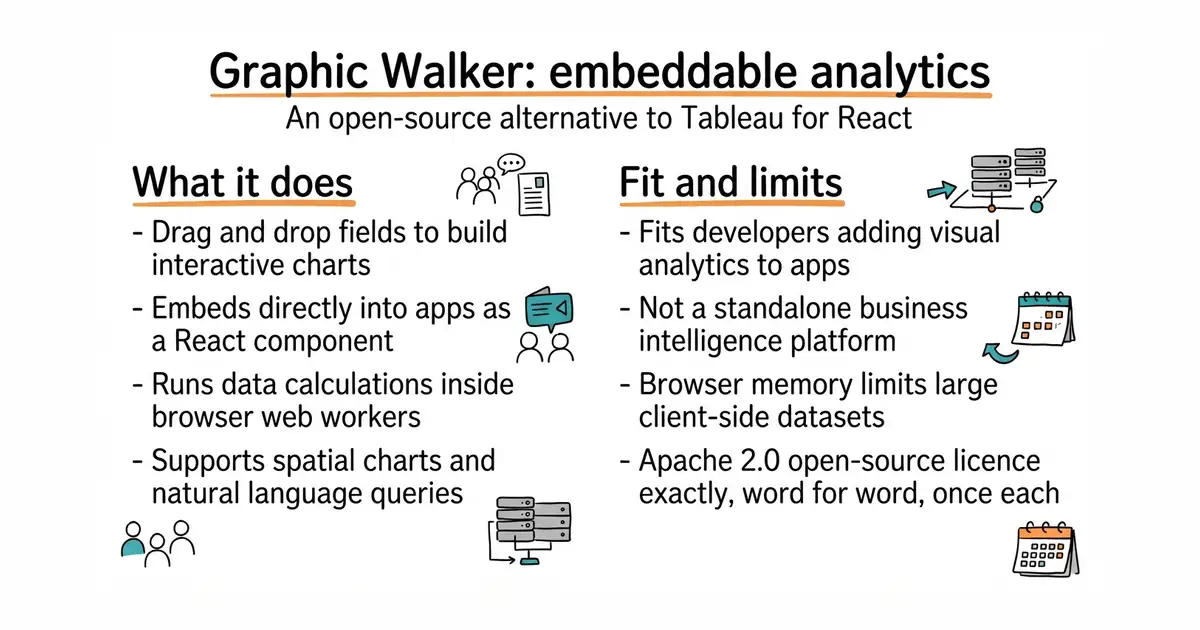
This tool lets you build visual charts and explore data by dragging fields around on your screen. It is an open-source alternative to expensive software like Tableau. You can embed it directly into your own web application as a React component. It runs data calculations inside your browser using web workers, so you do not need a heavy backend server. It is free to use under the Apache 2.0 licence.
What it is
Graphic Walker is a front-end visualization library and interactive widget built on TypeScript and Vega-Lite (a grammar of graphics for creating visualisations). It provides a drag-and-drop user interface for exploratory data analysis, spatial charts, and natural language queries.
What it is good for
Solo developers and product builders who want to give their users the ability to build custom charts, filter datasets, and explore data tables inside a web app without writing complex charting code from scratch.
- Easy to drop into any React application with a single component.
- Runs calculations in the browser using web workers so your server stays light.
- Supports custom themes, dark mode, and natural language data queries.
- Requires familiarity with React and front-end development to embed and configure.
- Large datasets processed entirely in the browser can slow down lower-end client devices.
- Limited to the features provided in the React component and query DSL.
Writing custom charting code with Vega-Lite or paying for heavy commercial business intelligence software.
React and DuckDB for handling data queries.
- vega/vega-lite5.5k stars
A declarative grammar for interactive graphics that powers the underlying chart rendering.
- plotly/plotly.js18k stars
A widely used JavaScript graphing library for building interactive charts in web browsers.
- apache/superset75k stars
A full-stack data exploration and visualization platform for enterprise use.


- GoogleChromeLabs/squoosh26k stars
A web page that compresses images in the browser and shows you the result before you save it.
- simple-icons/simple-icons26k stars
More than 3,400 brand logos as single-colour SVG files, released into the public domain.
- phosphor-icons/core394 stars
The raw SVG files and the catalogue for the Phosphor icon family, with no framework package attached.
npm i --save @kanaries/graphic-walker