Overview
Summary
The useful answer before the supporting detail.
Graphy is an AI-powered data visualization platform that helps users create and share beautiful, editable charts and data stories S1. It is used by marketers, analysts, product managers, and business leaders to turn raw data into clear, narrative-driven visuals without complex BI tools S155. The platform offers a free tier, paid plans, and a React charting SDK for embedding editable charts into software products S66 S11.
Product identity and positioning
Name, category, positioning, audience, and first-party claims.
- Identity: Graphy is an AI-powered data visualization platform and React charting SDK S1 S11.
- Core purpose: It simplifies data presentation and communication, enabling anyone to become a skilled data storyteller S1.
- Intended users: Marketers, agencies, data analysts, product managers, founders, executives, sales teams, and small business owners S155.
- Product scope: Graphy includes a web app for creating charts and a separate React SDK for embedding editable charts in products S1 S11.
- Positioning: Graphy positions itself as the fastest way to tell stories with data, turning messy data into beautiful graphs in a click S1.
- Claimed distinction: Graphy claims to be easier than Tableau, smarter than Canva, and faster than building custom slides S155.
Use cases and audiences
Who the product serves and the jobs it is designed to handle.
| Audience | Practical use case |
|---|---|
| Marketers | Create external-facing charts for newsletters, social feeds, and consulting S1. |
| Data analysts | Make sense of data from multiple sources in one place S1. |
| Product managers | Embed editable, on-brand charts into software products using the SDK S11. |
| Executives | Keep teams in the loop without sending them to a dashboard S1. |
| Sales teams | Produce marketing reports in minutes S66. |
Traffic and search
SEO analysis
Collected Oct 22, 2026graphy.app: an estimated 110,839 total monthly visits and about 19,845 monthly organic visits across 1,629 ranking keywords. Scout crawled 15 pages and measured a technical health score of 95/100.
Search summary
The useful answer before the supporting detail.
Graphy enables anyone to become a skilled data storyteller, by radically simplifying the way data is presented and communicated. . graphy.app: an estimated 110,839 total monthly visits and about 19,845 monthly organic visits across 1,629 ranking keywords. Scout crawled 15 pages and measured a technical health score of 95/100.
- Total traffic (modeled): 110,839 monthly visits across all channels.
- Organic search traffic (estimated): 19,845 monthly visits from search.
- Strongest sampled ranking: graphy at position 1.
- Leading page in the collected evidence: https://graphy.app/.
- Closest measured organic competitor: graphy.com, appearing 2 times in the sampled first-page SERPs.
- Technical crawl: 15 pages, health score 95/100.
Website intelligence — Collected evidence
Company identity and positioning
| Page type | Evidence | Source |
|---|---|---|
| integrations | Graphy enables anyone to become a skilled data storyteller, by radically simplifying the way data is presented and communicated. | https://graphy.app/ |
Domain performance
Modeled total traffic, six-month trend, engagement, countries, and domain identity.
Total website traffic
| Month | Modeled visits |
|---|---|
| 2026-04 | 200,360 |
| 2026-05 | 167,620 |
| 2026-06 | 119,126 |
| 2026-07 | 121,252 |
| 2026-08 | 107,778 |
| 2026-09 | 110,839 |
Top visitor countries
| Country | Name | Traffic share |
|---|---|---|
| IN | India | 14.4% |
| US | United States | 10.8% |
| GB | United Kingdom | 6.1% |
| VN | Vietnam | 3.8% |
| NL | Netherlands | 3.7% |
Domain identity
| Signal | Value |
|---|---|
| Registered | Jul 12, 2021 |
| Last changed | Jul 3, 2026 |
| Expires | Jul 12, 2027 |
| WHOIS server | — |
| DNSSEC | Not signed |
| Nameservers | ns-1338.awsdns-39.org, ns-1711.awsdns-21.co.uk, ns-172.awsdns-21.com, ns-756.awsdns-30.net |
Website capture
Organic keywords
Top keywords and an independent Google result page.
Top organic keywords
| Keyword | Volume | CPC | Estimated value |
|---|---|---|---|
| graphy | 26,680 | $1.84 | $2,050 |
| graph maker | 45,550 | $2.37 | $410 |
| graphy ai | 1,450 | $0.00 | $380 |
| is there a free ai made for specifically graphs | 320 | $0.00 | $300 |
| what ai can i use to make charts? | 0 | $0.00 | $260 |
Independent Google result page
Query: graphy
| Position | Title | URL | Description |
|---|---|---|---|
| 1 | Graphy - Make Beautiful Graphs Online For Free with AI | https://graphy.app/ | From messy data to beautiful graphs in a click, Graphy is the fastest way to tell stories with data. Start for free. Watch a demo. |
| 2 | Graphy - Build & Sell Courses, Memberships, Digital Products ... | https://graphy.com/ | GRAPHY Graphy is an all-in-one platform built for creators, coaches, and educators to run their knowledge business from a single place. |
| 3 | graphy | https://en.wikipedia.org/wiki/-graphy | The English suffix -graphy denotes either a field of study or a manner of writing or representation. It derives from the French -graphie comes from the Latin - ... |
| 4 | Graphy | create pro-level graphs that drive actions. | https://visualize.graphy.app/signup | Graphy | create pro-level graphs that drive actions. Sign up to Graphy Sign in or create an account to continue Continue with Google or Work email |
| 5 | Graphy Inc. | https://www.linkedin.com/company/graphyapp | Graphy helps you grow your audience, monetize your skills, and host live cohort-based courses. engagement, and fuel business growth, Monetize online courses, ... |
| 6 | Signup | https://graphy.com/signup/ | Graphy. Start Free Trial. No credit card required.. Get Started for Free. Already have an account?Log in. By continuing, you agree to our Terms & Services ... |
| 7 | Read Customer Service Reviews of graphy.com | https://www.trustpilot.com/review/graphy.com | Graphy is an all-in-one platform designed for creators, educators, and entrepreneurs to build, market, and sell online courses, memberships, and digital ... |
| 8 | GRAPHY Definition & Meaning | https://www.dictionary.com/browse/graphy | a combining form denoting a process or form of drawing, writing, representing, recording, describing, etc., or an art or science concerned with such a process. |
| 9 | Graphy (@graphyapp) • Instagram photos and videos | https://www.instagram.com/graphyapp/?hl=en | Create, sell & manage online courses AI-powered course creation Over 200K+ creators have launched their online teaching business using Graphy. Follow. |
Important pages
Pages earning the most estimated search traffic in the sample.
| URL | Ranking keywords | Estimated traffic | Best position |
|---|---|---|---|
| https://graphy.app/ | 14 | 1,659.8 | 1 |
| https://graphy.app/graphs/comparative-bar-graph-maker | 2 | 118.6 | 1 |
| https://graphy.app/graphs/graph-generator-from-table | 3 | 94.2 | 1 |
| https://graphy.app/graphs/graph-maker-with-trendline | 1 | 42.6 | 1 |
Website intelligence — Collected evidence
Prioritized website intelligence pages
| Type | Page | Words | Change | URL |
|---|---|---|---|---|
| integrations | Graphy - Make Beautiful Graphs Online For Free with AI | 1,010 | new | https://graphy.app/ |
| pricing | Graphy - Pricing | 417 | new | https://graphy.app/pricing |
| integrations | Graphy - Make Beautiful Graphs Online For Free with AI | 848 | new | https://graphy.app/careers |
| integrations | Graphy Blog | 437 | new | https://graphy.app/blog |
| integrations | Free Editable Graph Templates - Graphy | 417 | new | https://graphy.app/graphs |
| integrations | The Best Data Storytelling Tools in 2025 (Quick Reference Guide) | 1,023 | new | https://graphy.app/blog/blog-best-data-storytelling-tools |
| integrations | How to Add a Graph in Notion (The Most Professional-Looking Way) | 751 | new | https://graphy.app/blog/blog-how-to-add-graphs-in-notion |
| integrations | Designing Graphy's new hybrid AI interface | 1,058 | new | https://graphy.app/blog/designing-graphy-new-hybrid-ai-interface |
Features
No supporting public-page evidence was collected for this category.
Pricing and plans
| Page type | Evidence | Source |
|---|---|---|
| pricing | [Pricing](./pricing) | https://graphy.app/pricing |
| pricing | Use Graphy for free everywhere you want to share beautiful interactive charts. | https://graphy.app/pricing |
| pricing | Free for everyone | https://graphy.app/pricing |
| pricing | Get started with Free | https://graphy.app/pricing |
| pricing | $16 per user/month | https://graphy.app/pricing |
| pricing | Everything in Free, plus: | https://graphy.app/pricing |
| pricing | ](https://visualize.graphy.app/signup/?plan=plus&interval=yearly) | https://graphy.app/pricing |
| pricing | $36 per user/month | https://graphy.app/pricing |
| pricing | ](https://visualize.graphy.app/signup/?plan=business&interval=yearly) | https://graphy.app/pricing |
| pricing | Can I use Graphy for free? | https://graphy.app/pricing |
| pricing | Can I purchase on an annual basis? | https://graphy.app/pricing |
| pricing | Start for free | https://graphy.app/pricing |
Integrations and supported platforms
| Page type | Evidence | Source |
|---|---|---|
| integrations | [Blog](./blog) | https://graphy.app/ |
| integrations | [Pricing](./pricing) | https://graphy.app/ |
| integrations | ](https://graphy.dev)[ | https://graphy.app/ |
| integrations | ](https://graphy.dev/) | https://graphy.app/ |
| integrations | Log in | https://graphy.app/ |
| integrations | ](https://graphy.app/signup) | https://graphy.app/ |
| integrations | Our new tool for AI-native products | https://graphy.app/ |
| integrations | ](https://graphy.dev) | https://graphy.app/ |
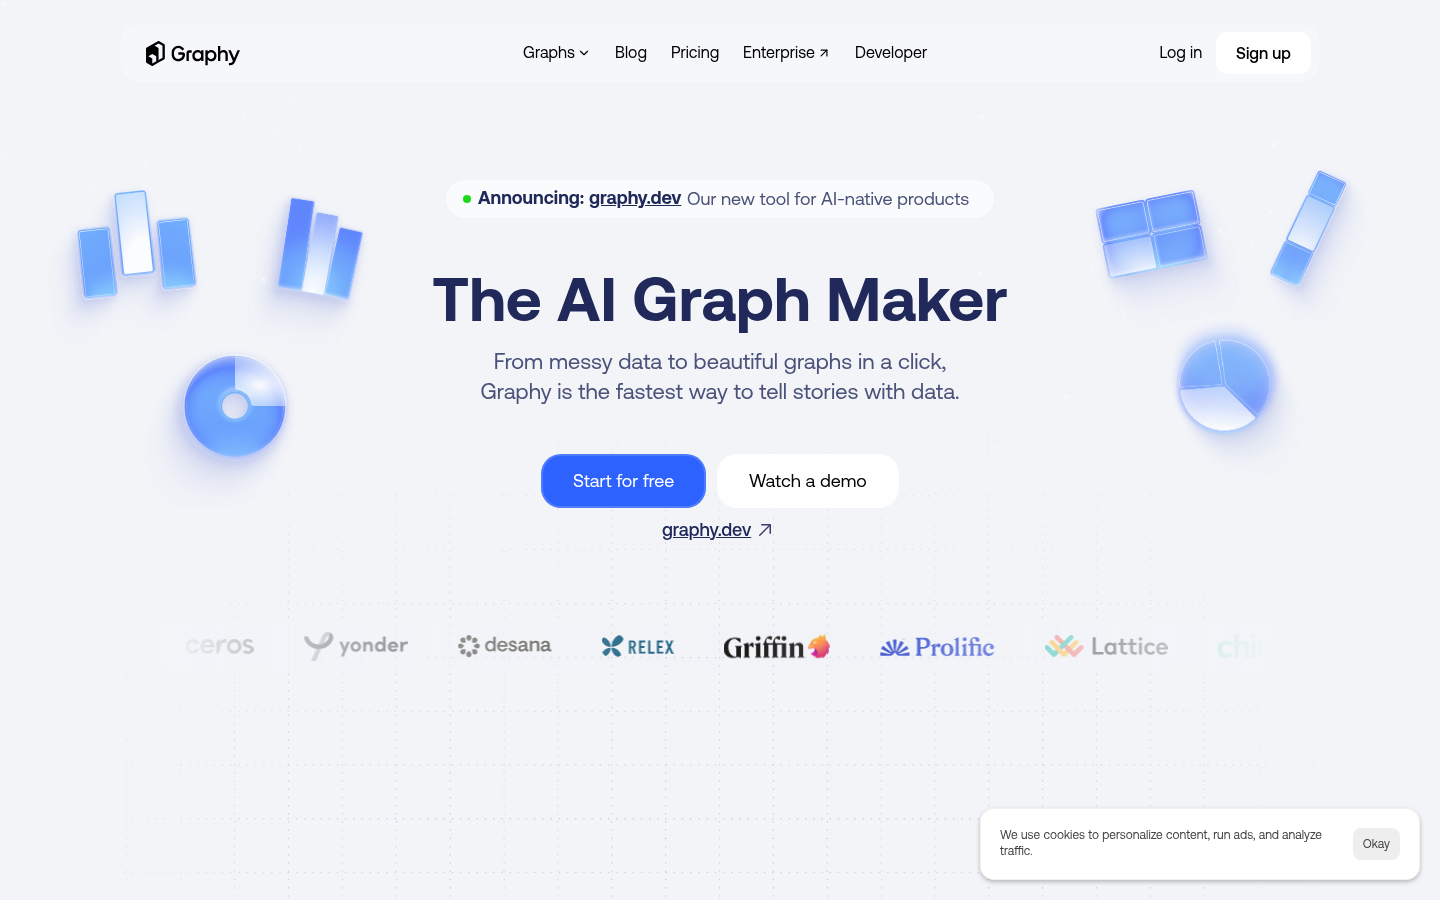
| integrations | The AI Graph Maker | https://graphy.app/ |
| integrations | From messy data to beautiful graphs in a click, | https://graphy.app/ |
| integrations | Graphy is the fastest way to tell stories with data. | https://graphy.app/ |
| integrations | From messy data to beautiful graphs in a click, Graphy is the fastest way to tell stories with data. | https://graphy.app/ |
| integrations | Start for free | https://graphy.app/ |
| integrations | Watch a demo | https://graphy.app/ |
| integrations | Benefits of data storytelling | https://graphy.app/ |
| integrations | Actionable insights | https://graphy.app/ |
| integrations | No ambiguity | https://graphy.app/ |
| integrations | Fewer meetings | https://graphy.app/ |
| integrations | Faster decisions | https://graphy.app/ |
| integrations | Less back & forth | https://graphy.app/ |
Product and company updates
No supporting public-page evidence was collected for this category.
Rank tracking
Persistent keyword baselines and position movement.
This analysis created the first position baseline at 2026-10-22T06:54:40.644Z. Movement appears after the next fresh analysis using the same location and language.
| Keyword | Current | Previous | Movement | Volume | Ranking URL |
|---|---|---|---|---|---|
| graphy | 1 | Baseline | Baseline | 3,600 | https://graphy.app/ |
| app graphs | 1 | Baseline | Baseline | 480 | https://graphy.app/ |
| ai graphs | 1 | Baseline | Baseline | 390 | https://graphy.app/ |
| comparative bar graphs | 1 | Baseline | Baseline | 320 | https://graphy.app/graphs/comparative-bar-graph-maker |
| ai graph generator free | 1 | Baseline | Baseline | 210 | https://graphy.app/ |
| data table to graph | 1 | Baseline | Baseline | 210 | https://graphy.app/graphs/graph-generator-from-table |
| ai generate graphs | 1 | Baseline | Baseline | 140 | https://graphy.app/ |
| ai generated graphs | 1 | Baseline | Baseline | 140 | https://graphy.app/ |
| graph with trendline | 1 | Baseline | Baseline | 140 | https://graphy.app/graphs/graph-maker-with-trendline |
| ai for graphs | 1 | Baseline | Baseline | 70 | https://graphy.app/ |
| ai graph creator | 1 | Baseline | Baseline | 70 | https://graphy.app/ |
| comparative graph | 1 | Baseline | Baseline | 70 | https://graphy.app/graphs/comparative-bar-graph-maker |
| graph ai generator | 1 | Baseline | Baseline | 70 | https://graphy.app/ |
| graph generator ai | 1 | Baseline | Baseline | 70 | https://graphy.app/ |
| i-graphy | 1 | Baseline | Baseline | 70 | https://graphy.app/ |
| create graph from table | 1 | Baseline | Baseline | 50 | https://graphy.app/graphs/graph-generator-from-table |
| graph creator ai | 1 | Baseline | Baseline | 50 | https://graphy.app/ |
| graphic charts online | 1 | Baseline | Baseline | 50 | https://graphy.app/ |
| graphy download | 1 | Baseline | Baseline | 50 | https://graphy.app/ |
| how to turn a table into a graph | 1 | Baseline | Baseline | 50 | https://graphy.app/graphs/graph-generator-from-table |
Features
Features and capabilities
Core functions and evidence-backed product capabilities.
| Capability | What it does |
|---|---|
| AI Chart Builder | Upload a CSV or spreadsheet and get the right chart, annotated and ready to share S155. |
| Brand Customization | Upload color swatches, add logos, and export visuals in your brand style S155. |
| Export & Embed | Download as PNG or embed charts anywhere S155. |
| Live Data Linking | Link a live Google Sheet, upload CSV or Excel, paste values, call the API, or ask AI to search for data S1. |
| SDK Editing | Users can click any part of a chart to access controls or describe an edit in a sentence for the agent to make S67. |
| Prompt-Driven Editing | Create and refine charts with natural language S11. |
| Chart Validation | Built-in chart validation ensures correct chart specifications S11. |
Integrations and ecosystem
Connected products, exports, APIs, and workflow compatibility.
| Integration or interface | Type | What it enables |
|---|---|---|
| Google Sheets | Integration | Link a live Google Sheet to keep charts updated automatically S1. |
| CSV/Excel | Data portability | Upload files to create charts from existing data S1. |
| API | API | Call Graphy's API to create charts programmatically S1. |
| React SDK | SDK | Embed editable, on-brand charts into React applications S11. |
| AI Agents | AI interface | Turn natural-language requests and raw data into chart specifications S11. |
| Styling API | API | Customize chart appearance with pre-built themes and detailed control S67. |
Pricing
Pricing and plans
Published plans, free access, trials, credits, and pricing limitations.
| Plan or offer | Verified price and billing | Included | Limits |
|---|---|---|---|
| Free | Free | Limited AI use (amount not published) S66 | 5 charts, Graphy watermark S66 |
| Plus | $16 / month, billed annually (20% off monthly) S66 | Unlimited AI features, unlimited charts, custom colors, no logo S66 | Not established |
| Business | $36 / month, billed annually (20% off monthly) S66 | Unlimited AI features, auto Google Sheets refresh, password links, brand kits S66 | Not established |
| SDK | Free for noncommercial use; businesses with <100 employees or <$1M revenue qualify for free; otherwise paid license with 32-day free evaluation S11 | React charting SDK with rendering, editing, annotations, theming, and optional AI agents S11 | Commercial use requires paid license for larger businesses S11 |
Competition
Competitive landscape
Domains competing for the same organic search demand.
Sampled competitors
| Competitor | First-page appearances | Sampled queries | Average position | Queries observed |
|---|---|---|---|---|
| graphy.com | 2 | 1 | 4 | graphy |
| apps.apple.com | 2 | 1 | 5 | app graphs |
| geogebra.org | 1 | 1 | 1 | app graphs |
| play.google.com | 1 | 1 | 2 | app graphs |
| en.wikipedia.org | 1 | 1 | 3 | graphy |
| developers.google.com | 1 | 1 | 3 | app graphs |
| visualize.graphy.app | 1 | 1 | 4 | graphy |
| linkedin.com | 1 | 1 | 5 | graphy |
| nces.ed.gov | 1 | 1 | 5 | app graphs |
| trustpilot.com | 1 | 1 | 7 | graphy |
Website intelligence — Collected evidence
Customers, testimonials, and first-party review claims
No supporting public-page evidence was collected for this category.
Independent review sources discovered
No links to supported independent review platforms were discovered on the collected pages.
Backlink profile
Authority and referring-domain signals.
Backlink comparison profile
- Domain rating: 46/100
- Backlinks: 26,058
- Referring domains: 2,497
- Dofollow backlinks: 54.0%
- Dofollow referring domains: 57.0%
Collection decision
The Scout search index remains intentionally excluded from automatic Scout analysis. This Scout traffic model profile costs 5 credits (0.5 cents) and is included in the first comparison run so its usefulness can be judged before the recurring collection is finalized.
AI visibility
Measured ChatGPT and Google AI mentions with cited sources.
AI-assistant referral traffic
- Estimated current generative-AI referral share: 1.1%
Scout traffic model did not return a separate AI-referral trend series for this domain.
Website intelligence — Collected evidence
Site-stated AI capabilities
| Page type | Evidence | Source |
|---|---|---|
| integrations | Our new tool for AI-native products | https://graphy.app/ |
| integrations | The AI Graph Maker | https://graphy.app/ |
| integrations | Link a live Google Sheet, upload a CSV or Excel file, paste or type values, call our API, or ask AI to search for data. | https://graphy.app/ |
| integrations | Let AI work its magic | https://graphy.app/ |
| integrations | Our AI inspects every row and spits out the three clearest charts — complete with headline take-aways. | https://graphy.app/ |
| integrations | Graphy exists to bring clear, beautiful data visualisation and storytelling to businesses and modern software products. Today, our product is used by hundreds of thousands of people, and some of the fastest growing AI companies are already building with our visualisations. | https://graphy.app/careers |
| integrations | Designing Graphy's new hybrid AI interface | https://graphy.app/blog |
| integrations | ](./blog/designing-graphy-new-hybrid-ai-interface)[ | https://graphy.app/blog |
| integrations | > Transform your data into compelling visuals with Graphy’s suite of free, professional-grade graph makers. Our AI-powered templates help you build beautiful, interactive charts in minutes—no design skills required. Choose from our most popular graph types below. | https://graphy.app/graphs |
These are first-party product claims, not independent measurements of AI-search visibility.
Marketing opportunities
Actions calculated directly from the collected evidence.
| Opportunity | Recommended action | Evidence |
|---|---|---|
| Competitor gap | Review the sampled queries where graphy.com appears. | 2 first-page appearances across graphy |
Website intelligence — Collected evidence
Website evidence gaps
- features: no usable public page was collected; verify whether the site publishes this evidence.
- customers: no usable public page was collected; verify whether the site publishes this evidence.
- reviews: no usable public page was collected; verify whether the site publishes this evidence.
- changes: no usable public page was collected; verify whether the site publishes this evidence.
- identity: no usable public page was collected; verify whether the site publishes this evidence.
- technical: no usable public page was collected; verify whether the site publishes this evidence.
Trust and proof
Customers, proof, and reviews
Published proof, customer signals, and review evidence.
Independent reviews
| Platform | Page | How it was found | Note |
|---|---|---|---|
| GistDam | Graphy Review: Fast, Beautiful Charts for Everyone? – GistDam | Grounded web search | The good is obvious: It’s fast, the user interface is a joy, and the final results are stunning. The integrations are top-notch. It solves a very real, very annoying problem for a huge number of professionals. |
| Futurepedia | Graphy AI Reviews: Use Cases, Pricing & Alternatives | Grounded web search | # Graphy Rated 5 out of 5 1 user reviews Revolutionizes data visualization with AI insights and seamless integrations. Pricing Model: Freemium, $20/mo ... ## Graphy Reviews 5/5 from 1 reviews (1) (0) Rated 5 out of 5 5 |
| redditmaster.com | Graphy on Reddit: Analysis of 2 Discussions (2026) / RedditMaster | Grounded web search | How this was measured: This report summarises 2 public Reddit threads collected across 2 subreddits through the Reddit API. Thread counts, subreddit shares, the weekly trend, and the date range are computed from those threads alone. Replies have not been collected for this brand yet, so the sentiment split is derived from thread titles and the question each thread asks, which leaves most threads unlabelled; the labels come from a fixed word list, not from human review. This is a sample of public |
Customer proof
No named customers, testimonials, or customer case studies were found.
Independent mentions
- Graphy 3.0 - From messy data to graphs with a story in seconds. / Product Hunt Launch Dashboard — Graphy 3.0 launched on Product Hunt on August 7th, 2025 and earned 270 upvotes and 52 comments, placing #8 on the daily leaderboard. Hate pivot tables? So do we. Graphy is the fastest way to turn messy data into clean, branded, presentation-ready graphs in seconds. ... Graphy 3.0 has received 12 reviews on Product Hunt with an average rating of 5.00/5.
- The AI Graph Maker — # The AI Graph Maker From messy data to beautiful graphs in a click, Graphy is the fastest way to tell stories with data. ... things get me as excited as beautiful charts do. Graphy has transformed the way we work with data for both internal and external
- Graphy Pricing & Features (2026) / RightAIChoice — We scanned public community sources for Graphy on Jul 3, 2026 and could not establish that the discussion we found is about this tool rather than something else sharing its name. ... of that scan says the posts were off-subject. Rather than publish a
- Graphy 3.0 - From messy data to graphs with a… / Innolope — Graphy 3.0 was launched on August 7, 2025 (about a year ago). Graphy 3.0 is active in the Analytics, SaaS, and Data visualization tools sectors. It ranks as a growing startup on Innolope, having received 253 votes and 52 comments.
- Graphy AI Pricing & Features (2026) / RightAIChoice — We scanned public community sources for Graphy AI on Aug 15, 2026 and could not establish that the discussion we found is about this tool rather than something else sharing its name. ... of that scan says the posts were off-subject. Rather than publish a
- Andrey Vinitsky (@andreyv) — Product Hunt Hunter Profile — ## Hunted products (4) By time 8 Graphy 3.0 270 52 4 Graphy AI 609 94 2 Graphy for Data Storytelling ... joined Product Hunt in November 2016 and has hunted 4 featured products, collected 2,129
External links were grounded in one live web search. Search snippets are leads, not independently scraped page content; rejected links remain available in Review evidence.
Company, security, and trust
Ownership, policies, security signals, and public trust evidence.
| Signal | Finding | Source |
|---|---|---|
| Company and ownership | Founder of Product Hunt | source |
| Contact and support | Not published on the collected pages. | — |
| Legal and privacy | What happens if I cancel my Plus account? | source |
| Security and compliance | Graphy is SOC 2 Type 2 compliant, independently audited and penetration tested every year. Every policy, control and subprocessor is published in our trust center. | source |
| Uptime and status page | Not published on the collected pages. | — |
| Domain registered | 2021-07-12 | — |
| Domain expires | 2027-07-12 | — |
Not found on the collected pages: contact and support, uptime and status page. This only means Scout did not find it on the pages it read; it says nothing about the company itself.
Documentation and product updates
Help resources, product guidance, and visible changes over time.
| Resource or update | Type | What is available | Date or freshness |
|---|---|---|---|
| Product FAQ | FAQ | Answers common product, workflow, pricing, privacy, ownership, API, and team questions. (source) | Not dated |
| The Best Data Storytelling Tools in 2025 (Quick Reference Guide) | Guide | Guides, comparisons, pricing breakdowns, use cases, and how-to articles. (source) | Not dated |
Not found in the collected public sources: public roadmap, changelog or release notes, status page, separate help center or knowledge base.
Technical
Technical and delivery signals
Delivery model, platforms, API, data ownership, reliability claims and release activity.
| Signal | Finding | Source |
|---|---|---|
| Delivery model (cloud, self-hosted, desktop, browser extension) | Graphy is a web app and also offers a React SDK for embedding in products S1 S11. | S1 S11 |
| Platforms and apps | The web app runs in the browser; the SDK is for React applications S1 S11. | S1 S11 |
| API and extensibility (API, SDK, webhooks, MCP, plugins) | Provides an API, a React SDK, and AI agents S1 S11. | S1 S11 |
| Data ownership and export | Charts can be exported as PNG or embedded S155. | S155 |
| Performance and reliability claims | Not published on the collected pages. | — |
| Release activity | Not published on the collected pages. | — |
Measured infrastructure
Domain, certificate, and hosting signals, measured directly.
| Signal | Finding |
|---|---|
| Domain registered | 2021-07-12 — Squarespace Domains II LLC. |
| Domain expires | 2027-07-12 |
| First archived | 2021-10-27 — web archive |
| TLS certificate | Let's Encrypt, valid, expires 2026-12-30 |
| Security headers | HSTS, X-Content-Type-Options |
| Headers not served | CSP, X-Frame-Options, Referrer-Policy |
| Server header | Framer/24ab00f |
| Mail handled by | aspmx.l.google.com, alt1.aspmx.l.google.com |
| Nameservers | ns-1338.awsdns-39.org, ns-1711.awsdns-21.co.uk |
Technical site audit
A bounded multi-page crawl with page-level issues and URLs.
Scout — Bounded technical crawl
- Pages crawled: 15 of 15 maximum
- Technical health: 95/100
- Critical issues: 0
- Warnings: 9
- Notices: 15
Issues
| Severity | Issue | Value | Affected URL |
|---|---|---|---|
| notice | Images are missing alt text | 129 | https://graphy.app/ |
| warning | Page should have one primary H1 | 2 | https://graphy.app/blog |
| notice | Images are missing alt text | 64 | https://graphy.app/blog |
| warning | Page should have one primary H1 | 0 | https://graphy.app/pricing |
| notice | Images are missing alt text | 41 | https://graphy.app/pricing |
| warning | Missing meta description | — | https://visualize.graphy.app/signup |
| warning | Page should have one primary H1 | 0 | https://visualize.graphy.app/signup |
| warning | Missing canonical URL | — | https://visualize.graphy.app/signup |
| notice | Low visible word count | 0 | https://visualize.graphy.app/signup |
| warning | Page should have one primary H1 | 0 | https://graphy.app/graphs |
| notice | Images are missing alt text | 20 | https://graphy.app/graphs |
| notice | Images are missing alt text | 115 | https://graphy.app/graphs/horizontal-bar-graph-maker |
| notice | Images are missing alt text | 113 | https://graphy.app/graphs/stacked-bar-graph-maker |
| notice | Images are missing alt text | 115 | https://graphy.app/graphs/line-graph-maker-with-multiple-lines |
| notice | Images are missing alt text | 121 | https://graphy.app/graphs/line-graph-maker |
| notice | Images are missing alt text | 114 | https://graphy.app/graphs/funnel-chart-maker |
| notice | Images are missing alt text | 109 | https://graphy.app/graphs/sales-funnel-chart-maker |
| notice | Images are missing alt text | 114 | https://graphy.app/graphs/comparative-bar-graph-maker |
| notice | Images are missing alt text | 109 | https://graphy.app/graphs/table-maker |
| notice | Images are missing alt text | 114 | https://graphy.app/graphs/graph-generator-from-table |
| notice | Images are missing alt text | 113 | https://graphy.app/graphs/graph-maker-with-trendline |
| warning | Duplicate meta description in audit sample | 3 | https://graphy.app/ |
| warning | Duplicate meta description in audit sample | 3 | https://graphy.app/blog |
| warning | Duplicate meta description in audit sample | 3 | https://graphy.app/graphs |
Crawled pages
| Status | Title | H1s | Words | Response | URL |
|---|---|---|---|---|---|
| 200 | Graphy - Make Beautiful Graphs Online For Free with AI | 1 | 3019 | 51 ms | https://graphy.app/ |
| 200 | Graphy Blog | 2 | 557 | 18 ms | https://graphy.app/blog |
| 200 | Graphy - Pricing | 0 | 723 | 70 ms | https://graphy.app/pricing |
| 200 | Graphy \ | create pro-level graphs that drive actions. | 0 | 0 | 125 ms |
| 200 | Free Editable Graph Templates - Graphy | 0 | 493 | 51 ms | https://graphy.app/graphs |
| 200 | Best Free Horizontal Bar Graph Maker Online - Graphy | 1 | 3731 | 46 ms | https://graphy.app/graphs/horizontal-bar-graph-maker |
| 200 | Best Free Stacked Bar Graph Maker Online - Graphy | 1 | 3509 | 66 ms | https://graphy.app/graphs/stacked-bar-graph-maker |
| 200 | Best Free Line Graph Maker with Multiple Lines - Graphy | 1 | 3695 | 201 ms | https://graphy.app/graphs/line-graph-maker-with-multiple-lines |
| 200 | Best Free Line Graph Maker Online - Graphy | 1 | 3700 | 237 ms | https://graphy.app/graphs/line-graph-maker |
| 200 | Best Free Funnel Chart Maker Online - Graphy | 1 | 3427 | 281 ms | https://graphy.app/graphs/funnel-chart-maker |
| 200 | Free Sales Funnel Chart Maker - Graphy | 1 | 3352 | 43 ms | https://graphy.app/graphs/sales-funnel-chart-maker |
| 200 | Best Free Comparative Bar Graph Maker Online - Graphy | 1 | 3383 | 21 ms | https://graphy.app/graphs/comparative-bar-graph-maker |
| 200 | Best Free Table Graph Maker Online - Graphy | 1 | 3222 | 198 ms | https://graphy.app/graphs/table-maker |
| 200 | Graph Generator from Table Data - Beautiful Charts Made Easy | 1 | 3225 | 214 ms | https://graphy.app/graphs/graph-generator-from-table |
| 200 | Best Free Graph Maker with Trendline - Graphy | 1 | 3604 | 29 ms | https://graphy.app/graphs/graph-maker-with-trendline |
This is a bounded Scout crawl. Core Web Vitals and Lighthouse scores are not claimed unless a dedicated performance audit is connected.
Search Console and Analytics
First-party search and behavioral data connection state.
Modeled acquisition channels
| Channel | Estimated share |
|---|---|
| direct | 19.8% |
| search | 68.6% |
| search organic | 68.6% |
| search paid | 0.0% |
| social | 4.4% |
| social organic | 4.4% |
| social paid | 0.0% |
| referrals | 4.6% |
| paid referrals | 0.0% |
| 0.0% | |
| gen ai | 1.1% |
| affiliate | 1.5% |
| other | 0.0% |
First-party connections
| Integration | Status | Data available after connection |
|---|---|---|
| Google Search Console | Not connected | Clicks, impressions, CTR, average position, queries, pages, countries, and devices |
| Google Analytics | Not connected | Organic sessions, engagement, landing pages, conversions, geography, and devices |
No first-party Search Console or Analytics numbers are shown until the site owner authorizes the corresponding Google account. Scout traffic model values above are modeled estimates, not private analytics totals.
Limits and method
Limitations and open questions
Known constraints and missing evidence from the collected pages.
The collected pages do not mention specific competitors by name, except for a blog post that compares Graphy to Tableau, Canva, and Power BI S155. Evidence gaps include lack of detailed pricing for the SDK, no customer case studies with measurable outcomes, and no information on data retention or export formats beyond PNG. Open questions include the exact limits of the free AI usage and the full feature set of the Business plan.
Sources, method, and limitations
Evidence inventory, collection method, provider use, and constraints.
This report is based on 13 of 15 collected pages from graphy.app and graphy.dev, including the homepage, pricing page, SDK documentation, chart examples, and a blog post. Static and browser rendering rendering were used; external proof search was enabled but only verified the existence of linked results, not their content. The evidence catalog contains 173 entries, but only a subset was relevant to this report. Limitations include missing pages (e.g., terms, privacy) and the inability to verify customer testimonials independently.
- Documentationhttps://graphy.app/Verified
- Pricing Pagehttps://graphy.app/pricingVerified
- Official Websitehttps://graphy.dev/Verified
- Official Websitehttps://graphy.dev/charting-sdkVerified
- Official Websitehttps://graphy.dev/charts/react-horizontal-bar-chartVerified
- Official Websitehttps://graphy.dev/charts/react-funnel-chartVerified
- Official Websitehttps://graphy.dev/charts/react-pie-chartVerified
- Official Websitehttps://graphy.dev/charts/react-waterfall-chartVerified
- Documentationhttps://graphy.app/careersVerified
- Documentationhttps://graphy.app/blogVerified
- Documentationhttps://graphy.app/graphsVerified
- Documentationhttps://graphy.app/manifestoVerified
- Documentationhttps://graphy.app/blog/blog-best-data-storytelling-toolsVerified
- Review Sitehttps://www.producthunt.com/products/graphy-liteVerified
- Articlehttps://hunted.space/dashboard/graphy-lite/launches/graphy-3-0Verified
- Review Sitehttps://gistdam.com/graphy/Verified
- Review Sitehttps://www.futurepedia.io/tool/graphyVerified
- Articlehttps://rightaichoice.com/tools/graphyVerified
- Articlehttps://innolope.com/pulse/startups/69156a27f915b3ab4c719130Verified
- Articlehttps://rightaichoice.com/tools/graphy-aiVerified
- Review Sitehttps://www.redditmaster.com/reddit-intelligence/graphyVerified
- Articlehttps://hunted.space/hunter/andreyvVerified