In simple English
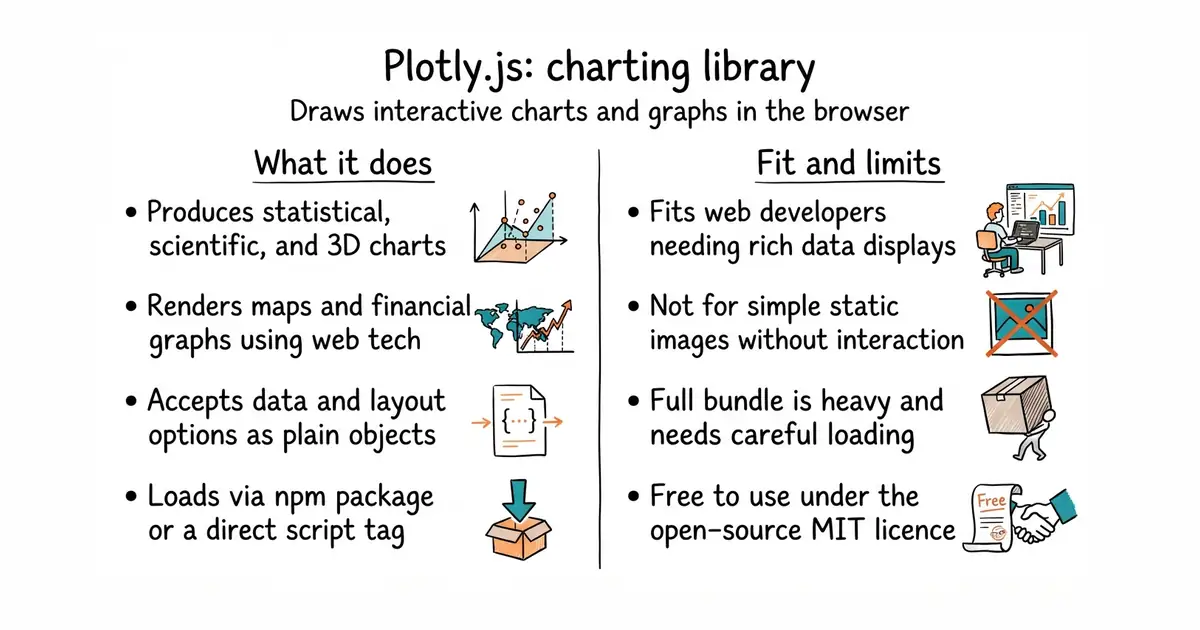
This library lets you draw charts on web pages. You feed it numbers and settings, and it builds interactive graphs. It handles lines, bars, maps, and 3D shapes. You do not pay anything to use it. It is free under an MIT licence.
What it is
Plotly.js is a standalone JavaScript data visualization library for the web. It provides dozens of chart types and powers the plotting engines used in other programming languages.
What it is good for
Solo builders who need to display complex data, scientific graphs, or financial charts in a web browser without writing a drawing engine from scratch.
- Draws dozens of chart types out of the box, including maps and 3D graphs.
- Free to use under the MIT licence with active maintenance.
- Can be loaded directly from a content delivery network via a simple script tag.
- The full download bundle is very large and can slow down page loading times.
- Requires writing JavaScript or JSON configuration objects for every chart detail.
- Documentation is split across multiple external websites and repositories.
Writing custom drawing code with HTML canvas or SVG elements by hand.
React or plain HTML pages served with Node.js.
- d3/d3114k stars
Low-level manipulation library for documents based on data, which Plotly uses underneath.
- highcharts/highcharts12k stars
Feature-rich charting library with commercial licence requirements for some users.


- GoogleChromeLabs/squoosh26k stars
A web page that compresses images in the browser and shows you the result before you save it.
- simple-icons/simple-icons26k stars
More than 3,400 brand logos as single-colour SVG files, released into the public domain.
- phosphor-icons/core394 stars
The raw SVG files and the catalogue for the Phosphor icon family, with no framework package attached.
npm i --save plotly.js-dist-min