In simple English
This tool draws charts on a web page. You give it numbers and tell it what kind of graph you want. It turns your data into lines, bars or pie slices that users can see. It is free to use on any personal or commercial site. You need to know some JavaScript to make it work.
What it is
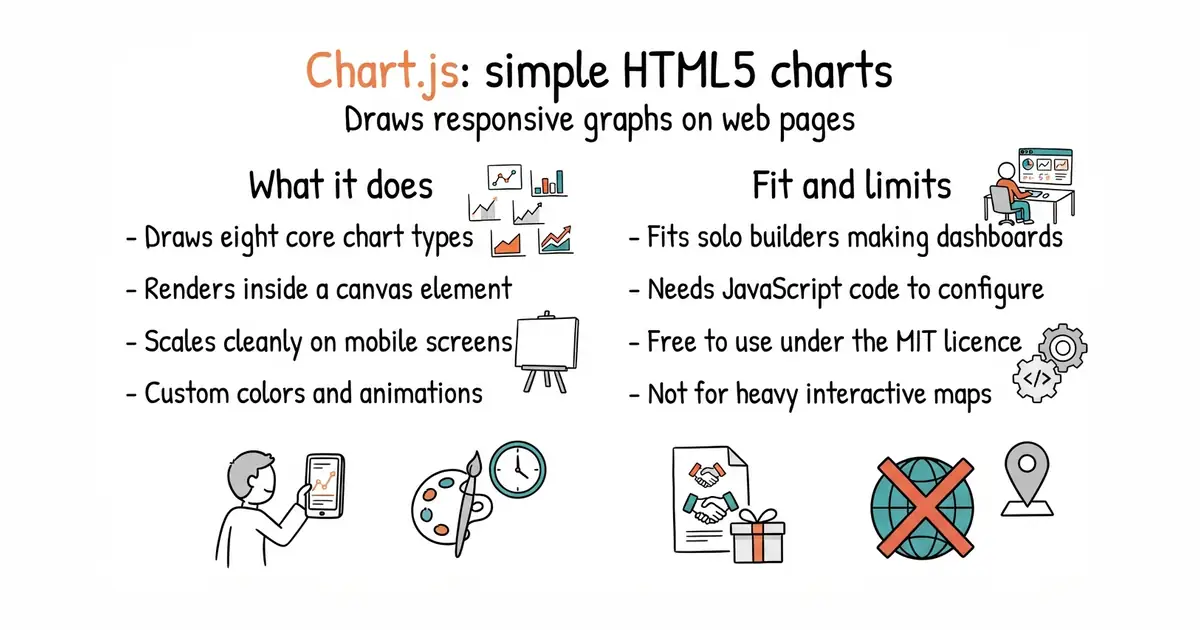
A JavaScript library that creates responsive charts inside an HTML5 canvas element. It supports eight different chart types out of the box and lets you customize colors and animations.
What it is good for
Solo builders who need to display data dashboards, user statistics or financial reports on their websites without paying for heavy third-party services.
- Draws crisp charts that scale well on mobile phone screens and high-resolution displays.
- Comes with clear documentation and many ready-to-use examples on the official website.
- Uses the permissive MIT licence, so you can use it in commercial projects without worry.
- Requires writing JavaScript code to feed data and configure how each graph looks.
- Can slow down the web page if you try to display thousands of data points at once.
- Offers less interactivity than heavy mapping libraries when users want to drill down into complex data.
drawing static images by hand or paying for hosted dashboard widgets
Tailwind CSS
- apexcharts/apexcharts.js15k stars
An alternative JavaScript charting library with a heavy focus on interactive dashboards.
- d3/d3114k stars
A much more complex low-level graphics library for building custom data visualisations from scratch.


- GoogleChromeLabs/squoosh26k stars
A web page that compresses images in the browser and shows you the result before you save it.
- simple-icons/simple-icons26k stars
More than 3,400 brand logos as single-colour SVG files, released into the public domain.
- phosphor-icons/core394 stars
The raw SVG files and the catalogue for the Phosphor icon family, with no framework package attached.
npm install chart.js