Overview
Summary
The useful answer before the supporting detail.
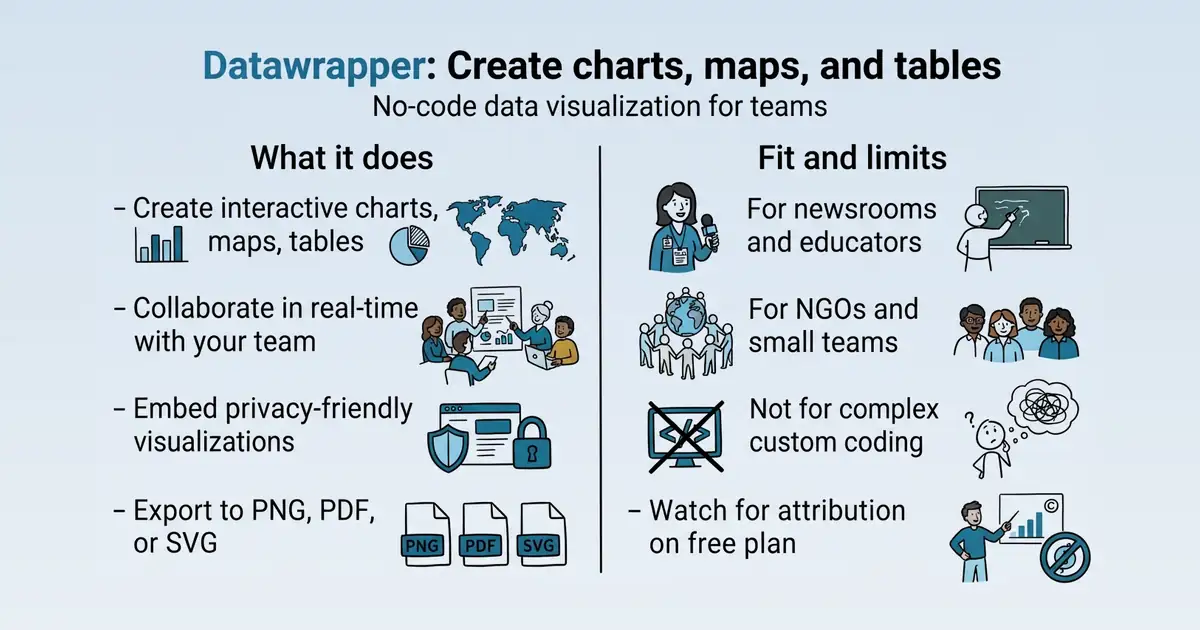
Datawrapper is an online tool for creating interactive, responsive charts, maps, and tables without writing code S69. It is used by teams and organizations to design professional visualizations, with features like real-time collaboration and privacy-friendly embedding S69 S11. The main practical value is enabling users to go from data to publication quickly, with options for free and paid plans S69 S114.
Product identity and positioning
Name, category, positioning, audience, and first-party claims.
- Identity: Datawrapper is an online data visualization tool for creating charts, maps, and tables S69.
- Core purpose: It solves the problem of creating professional, code-free visualizations for publication S69.
- Intended users: Teams and organizations that need to produce charts, maps, and tables for their work S69.
- Product scope: It is a web application with an editor, collaboration features, and an API S1 S30.
- Positioning: Datawrapper positions itself as a tool that helps users design great visualizations from first step to final publication S69.
- Claimed distinction: It emphasizes privacy-friendly embedding and compliance with regulations like GDPR S11.
Use cases and audiences
Who the product serves and the jobs it is designed to handle.
| Audience | Practical use case |
|---|---|
| Newsrooms | Create and embed interactive charts for articles S1. |
| Educators | Teach data visualization with free unlimited publishing and collaboration S114. |
| NGOs | Create visualizations despite financial constraints, with free plan options S114. |
| Teams | Collaborate on charts in real-time and manage permissions S11. |
Traffic and search
SEO analysis
Collected Oct 22, 2026datawrapper.de: an estimated 562,412 total monthly visits and about 76,733 monthly organic visits across 5,266 ranking keywords. Scout crawled 15 pages and measured a technical health score of 92/100.
Search summary
The useful answer before the supporting detail.
Create interactive, responsive & beautiful data visualizations with the online tool Datawrapper — no code required. datawrapper.de: an estimated 562,412 total monthly visits and about 76,733 monthly organic visits across 5,266 ranking keywords. Scout crawled 15 pages and measured a technical health score of 92/100.
- Total traffic (modeled): 562,412 monthly visits across all channels.
- Organic search traffic (estimated): 76,733 monthly visits from search.
- Strongest sampled ranking: create visualizations at position 1.
- Leading page in the collected evidence: https://www.datawrapper.de/.
- Closest measured organic competitor: medium.com, appearing 2 times in the sampled first-page SERPs.
- Technical crawl: 15 pages, health score 92/100.
Website intelligence — Collected evidence
Company identity and positioning
| Page type | Evidence | Source |
|---|---|---|
| other | Create interactive, responsive & beautiful data visualizations with the online tool Datawrapper — no code required. | https://www.datawrapper.de/ |
| other | Embed your visualizations on any platform, in any format. | https://www.datawrapper.de/ |
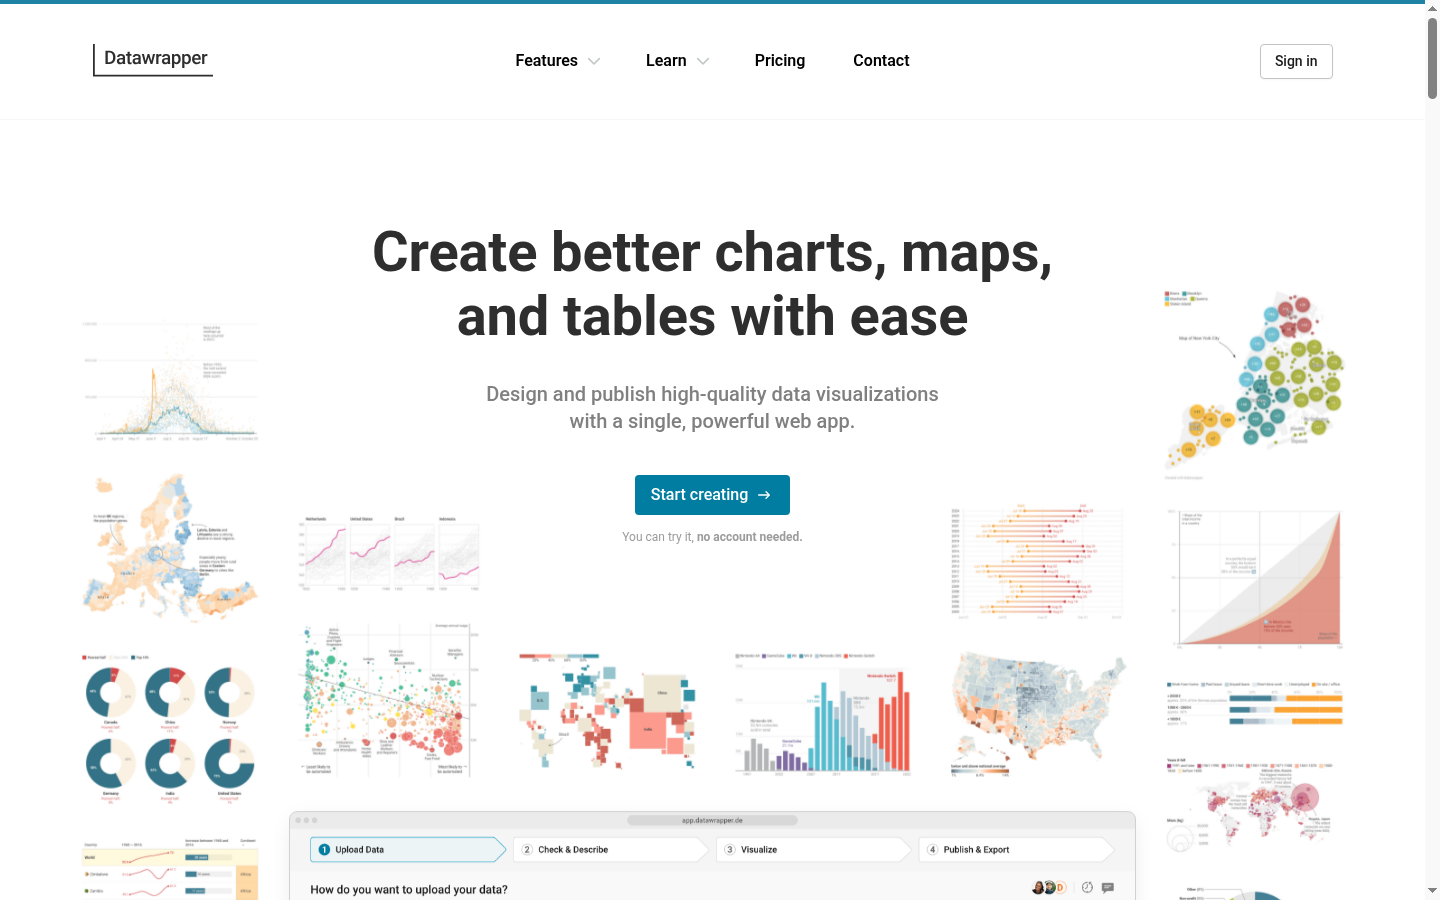
| other | Datawrapper helps you to design great visualizations. From the first step to the final publication. | https://www.datawrapper.de/ |
| other | Every element of visualizations was carefully optimized for the best possible display – from layout and typography, all the way to legends, axes, and tooltips. | https://www.datawrapper.de/ |
| other | Empower your team to build better charts in less time | https://www.datawrapper.de/ |
| other | Consistently create professional visualizations, no matter the size of your team. | https://www.datawrapper.de/ |
| other | Custom themes, templates, and shared default settings ensure consistency and quality across your team’s output. Learn more | https://www.datawrapper.de/ |
| other | (Re)publish without getting the whole team involved. | https://www.datawrapper.de/ |
| other | With real-time collaboration right inside the editor, and comments for quick reviews and feedback. Learn more | https://www.datawrapper.de/ |
| other | Access your team’s charts, maps, and tables in one place. | https://www.datawrapper.de/ |
| other | Set up folders and workflows that reflect the way your team works. Accessible from anywhere by everyone on the team. Learn more | https://www.datawrapper.de/ |
| other | Split work into multiple, separate teams. | https://www.datawrapper.de/ |
Website intelligence — Scout synthesis
- Datawrapper positions itself as a web app for creating charts, maps, and tables, emphasizing ease of use, professional design, and accessibility W2W3W10W13.
- The homepage highlights a no-account-needed trial, embedding across platforms, and brand customization W5W7W16.
- Pricing is tiered (Free, Pro, Business, Enterprise), with Pro removing attribution and adding PDF/SVG exports, and Business adding waterfall/dual-axis charts W33W34W38.
- A public API supports programmatic chart creation and editing, with free monthly usage limits W142W144.
- A PowerPoint add-in enables creating and updating visualizations directly in presentations W164W170W173.
- The features page lists 25 interactive visualization types, 4,000+ basemaps, and accessibility tools W94W100W109.
- A changelog documents recent fixes and new map additions, indicating active development W231W235.
Domain performance
Modeled total traffic, six-month trend, engagement, countries, and domain identity.
Total website traffic
| Month | Modeled visits |
|---|---|
| 2026-04 | 708,721 |
| 2026-05 | 679,256 |
| 2026-06 | 601,266 |
| 2026-07 | 521,380 |
| 2026-08 | 481,780 |
| 2026-09 | 562,412 |
Top visitor countries
| Country | Name | Traffic share |
|---|---|---|
| US | United States | 45.3% |
| GB | United Kingdom | 9.9% |
| IN | India | 3.7% |
| DE | Germany | 3.4% |
| IT | Italy | 3.3% |
Domain identity
| Signal | Value |
|---|---|
| Registered | May 23, 2026 |
| Last changed | — |
| Expires | — |
| WHOIS server | whois.denic.de |
| DNSSEC | — |
| Nameservers | gene.ns.cloudflare.com, kai.ns.cloudflare.com |
Website capture
Organic keywords
Top keywords and an independent Google result page.
Top organic keywords
| Keyword | Volume | CPC | Estimated value |
|---|---|---|---|
| datawrapper | 36,760 | $2.81 | $43,750 |
| data wrapper | 2,950 | $4.66 | $3,120 |
| datawrapper login | 370 | $0.00 | $490 |
| dara wrapper | 400 | $0.00 | $430 |
| datawarpper | 180 | $0.00 | $390 |
Independent Google result page
Query: create visualizations
| Position | Title | URL | Description |
|---|---|---|---|
| 1 | Flourish | https://flourish.studio/ | Create data visualizations and interactive content – no coding needed. Create stunning charts, maps and interactive content that engage and inspire – instantly ... |
| 2 | Datawrapper: Create charts, maps, and tables | https://www.datawrapper.de/ | Create interactive, responsive & beautiful data visualizations with the online tool Datawrapper — no code required. |
| 3 | What Is Data Visualization? Definition, Examples, And ... | https://www.tableau.com/visualization/what-is-data-visualization | Data visualization is the graphical representation of information and data. By using visual elements like charts, graphs, and maps, data visualization tools ... |
| 4 | Add Visualizations to a Power BI Report | https://learn.microsoft.com/en-us/power-bi/visuals/power-bi-report-add-visualizations | This article explains how to create and modify. You learn how to add visuals by selecting fields, change visualization types, and use drag-and- ... |
| 5 | RAWGraphs | https://www.rawgraphs.io/ | A free and open source tool for data visualization. Almost 30 visual models to visualize quantities, hierarchies, time series and find insights in your data. |
| 6 | Infogram: Turn Data Into Interactive Stories | https://infogram.com/ | Infogram's AI helps you create visuals, suggest charts, adjust content, and convert images into data - all in seconds. |
| 7 | Create Visualizations | https://university.gooddata.com/courses/getting-started/create-visualizations/ | Visualizations are created using facts , metrics , attributes , and optionally filters that are combined in a way to visualize a particular aspect of your data. |
| 8 | Data Visualization in Power BI: Tutorial Part 1 | https://www.youtube.com/watch?v=VoMWjJEglHI | In this video lecture series, we introduce Power BI (Business Intelligence), show users how to create data dashboards with visuals including ... |
| 9 | Graph Maker - Create online charts & diagrams in minutes | https://www.canva.com/graphs/ | Easily create your customized charts & diagrams with Canva's free online graph maker. Choose from 20+ chart types & hundreds of templates. |
| 10 | Data Visualization Tools | https://mcw.libguides.com/data-visualization/tools | Piktochart - Piktochart is a design tool that allows you to create infographics and dashboards, and input data to incorporate simple charts. |
Important pages
Pages earning the most estimated search traffic in the sample.
| URL | Ranking keywords | Estimated traffic | Best position |
|---|---|---|---|
| https://www.datawrapper.de/ | 6 | 261.4 | 1 |
| https://app.datawrapper.de/create/map | 7 | 164.2 | 1 |
| https://www.datawrapper.de/academy/how-to-create-a-bump-chart | 2 | 42.6 | 1 |
| https://www.datawrapper.de/academy/how-to-import-data-choropleth-map | 2 | 42.6 | 1 |
| https://www.datawrapper.de/blog/animal-hearing-frequency | 1 | 21.3 | 1 |
| https://www.datawrapper.de/blog/color-keys-for-data-visualizations | 2 | 18.2 | 1 |
Website intelligence — Collected evidence
Prioritized website intelligence pages
| Type | Page | Words | Change | URL |
|---|---|---|---|---|
| other | Datawrapper: Create charts, maps, and tables | 732 | new | https://www.datawrapper.de/ |
| pricing | Pricing \ | playwright | 2,375 | new |
| pricing | Business plan \ | playwright | 530 | new |
| pricing | Dual-axis & Waterfall Charts \ | playwright | 125 | new |
| features | Feature Overview \ | playwright | 579 | new |
| features | How to group nearby symbols \ | playwright | 778 | new |
| integrations | Getting started \ | playwright | 627 | new |
| integrations | PowerPoint Integration \ | static | 256 | new |
| integrations | What you can do with our API and how to use it \ | static | 539 | new |
| integrations | Getting started \ | static | 586 | new |
| changes | Changelog \ | static | 242 | new |
Features
| Page type | Evidence | Source |
|---|---|---|
| features | [Skip to main content](#main-content) | https://www.datawrapper.de/features |
| features | Everything you need to create professional and beautiful visualizations | https://www.datawrapper.de/features |
| features | Discover all features that help you create visualizations with ease and confidence. | https://www.datawrapper.de/features |
| features | Charts, maps, and tables | https://www.datawrapper.de/features |
| features | Explore 25 interactive, responsive, and accessible visualization types. | https://www.datawrapper.de/features |
| features | More than 20 chart types to visualize time, shares, relationships, and more | https://www.datawrapper.de/features |
| features | Annotations, overlays, and highlights to reveal key insights | https://www.datawrapper.de/features |
| features | Less effort through smart default design | https://www.datawrapper.de/features |
| features | More about charts | https://www.datawrapper.de/features |
| features | Put your data in place with symbol, choropleth, and locator maps | https://www.datawrapper.de/features |
| features | More than 4000 basemaps and cartograms to choose from | https://www.datawrapper.de/features |
| features | Built in annotations, tooltips, zoom, and more | https://www.datawrapper.de/features |
| features | More about maps | https://www.datawrapper.de/features |
| features | Add images to your table and style them to your liking | https://www.datawrapper.de/features |
| features | Heatmaps, and miniature charts to make your data easy to compare | https://www.datawrapper.de/features |
| features | Search, pagination, and sort options for big data sets | https://www.datawrapper.de/features |
| features | More about tables | https://www.datawrapper.de/features |
| features | Designed with everyone in mind | https://www.datawrapper.de/features |
| features | Datawrapper makes sure all your readers get the best experience. | https://www.datawrapper.de/features |
| features | Reduces eye strain while keeping your visualizations legible and looking great. Learn more | https://www.datawrapper.de/features |
Pricing and plans
Integrations and supported platforms
| Page type | Evidence | Source |
|---|---|---|
| integrations | [Skip to main content](#main-content) | https://www.datawrapper.de/developer/getting-started |
| integrations | Developer Docs | https://www.datawrapper.de/developer/getting-started |
| integrations | Guides | https://www.datawrapper.de/developer/getting-started |
| integrations | Reference | https://www.datawrapper.de/developer/getting-started |
| integrations | Getting started | https://www.datawrapper.de/developer/getting-started |
| integrations | The Datawrapper API lets you programmatically interface with your charts. It lets you create and edit charts, update your account information, and build integrations – like a chart viewer, or a CMS integration that lets team members embed charts right from where they write their articles. | https://www.datawrapper.de/developer/getting-started |
| integrations | If anything is unclear, please contact us at support@datawrapper.de. | https://www.datawrapper.de/developer/getting-started |
| integrations | Using the API is free for up to 500 Create operations, 1,000 Publish operations, and 3,000 Export operations per month. After that, you can keep using the API with flexible, credit-based billing. **Find more information on our pricing page.** | https://www.datawrapper.de/developer/getting-started |
| integrations | A quick note about CORS | https://www.datawrapper.de/developer/getting-started |
| integrations | The Datawrapper API is designed to be used in server-side scripts (or from a script on your computer). For security reasons, it is not possible to call the Datawrapper API from the browser. If you need to do that, you can build a proxy around the endpoints that you need to call from the browser. | https://www.datawrapper.de/developer/getting-started |
| integrations | Copy link to this heading Authentication | https://www.datawrapper.de/developer/getting-started |
| integrations | To use the Datawrapper API, you'll need to provide a personal access token with every request. You can create a token at app.datawrapper.de/account/api-tokens. | https://www.datawrapper.de/developer/getting-started |
| integrations | To create your token, click the Create new Access Token button. This will open the option to give your token a name and to select which read/write access you want to give it: | https://www.datawrapper.de/developer/getting-started |
| integrations | For example, if you want to get information about your account, you'll need to select `user:read`. If you want to create charts and upload them in a folder, you'll need to select `chart:read` `chart:write` and `folder:read` | https://www.datawrapper.de/developer/getting-started |
| integrations | `folder:write`. You can find required scopes for different API requests in our API reference. | https://www.datawrapper.de/developer/getting-started |
| integrations | Only choose the scopes you need, not more – if your API token gets stolen without you knowing it, you'll be glad you didn't give it User or Auth write access. You can still change the scope later by clicking Edit. | https://www.datawrapper.de/developer/getting-started |
| integrations | After clicking Generate token, your token will appear: | https://www.datawrapper.de/developer/getting-started |
| integrations | You won't be able to see the token again after you refresh the page, so copy it to a secure location – like to your password manager. | https://www.datawrapper.de/developer/getting-started |
| integrations | Keep your token secret | https://www.datawrapper.de/developer/getting-started |
| integrations | It is very important that you keep your token safe and secure. Do not share it publicly or push it to GitHub. You can revoke it at any time if you have any doubts about whether someone else got access to your API token. | https://www.datawrapper.de/developer/getting-started |
Product and company updates
| Page type | Evidence | Source |
|---|---|---|
| changes | [Skip to main content](#main-content) | https://www.datawrapper.de/changelog |
| changes | Latest improvements | https://www.datawrapper.de/changelog |
| changes | RSS | https://www.datawrapper.de/changelog |
| changes | October, 2026 | https://www.datawrapper.de/changelog |
| changes | charts and tables | https://www.datawrapper.de/changelog |
| changes | HTML entities such as ` `, ` ` or `€` in a column’s prepend/append fields now display as the expected character everywhere. | https://www.datawrapper.de/changelog |
| changes | When editing labels inline, pressing the Escape key now resets to the existing value rather than clearing the value altogether. | https://www.datawrapper.de/changelog |
| changes | multiple line charts | https://www.datawrapper.de/changelog |
| changes | Horizontal scales with numerical data now support the “prepend/append” and “divide/multiply by” options in Step 2. | https://www.datawrapper.de/changelog |
| changes | scatter plots | https://www.datawrapper.de/changelog |
| changes | Custom lines and areas are now displayed correctly in right-to-left locales. | https://www.datawrapper.de/changelog |
| changes | September, 2026 | https://www.datawrapper.de/changelog |
| changes | We added the following maps in September: | https://www.datawrapper.de/changelog |
| changes | 🇦🇲 Armenia: Communities | https://www.datawrapper.de/changelog |
| changes | 🇧🇪 Belgium: 2025 Provinces | https://www.datawrapper.de/changelog |
| changes | 🇮🇸 Iceland: 2026 Municipalities | https://www.datawrapper.de/changelog |
Website intelligence — Scout synthesis
- The homepage (datawrapper.de) is titled "Datawrapper: Create charts, maps, and tables" and leads with the value proposition "Create better charts, maps, and tables with ease" W1W2.
- The pricing page (datawrapper.de/pricing) is titled "Pricing | Datawrapper" and presents plans for teams of every size W25W26.
- A dedicated business plan page (datawrapper.de/pricing/business) explains waterfall and dual-axis chart features W49W50.
- The features page (datawrapper.de/features) is titled "Feature Overview | Datawrapper" and lists visualization types, maps, tables, and accessibility features W91W92W94.
- Developer documentation (datawrapper.de/developer/getting-started) covers API authentication and usage W139W142.
- A PowerPoint integration page (datawrapper.de/powerpoint-integration) describes the add-in for presentations W163W164.
- The changelog page (datawrapper.de/changelog) documents recent product updates and new maps W229W235.
- Academy pages provide tutorials, such as grouping symbols on maps and using the API W115W181.
Rank tracking
Persistent keyword baselines and position movement.
This analysis created the first position baseline at 2026-10-22T06:51:51.783Z. Movement appears after the next fresh analysis using the same location and language.
Features
Features and capabilities
Core functions and evidence-backed product capabilities.
| Capability | What it does |
|---|---|
| Chart, map, and table creation | Create interactive, responsive visualizations with a step-based editor S69. |
| Real-time collaboration | Work on the same chart with multiple people simultaneously, with comments for feedback S11 S69. |
| Embedding and export | Embed visualizations on any platform, or export as PNG, PDF, or SVG S11. |
| Privacy-friendly embedding | Embed without trackers, cookies, or third-party scripts, compliant with GDPR and CCPA S11. |
| Permission management | Control team member access to visualizations with fine-grained permissions S11 S114. |
| API automation | Use the Datawrapper API to programmatically create, edit, and publish charts S30. |
| PowerPoint integration | Create and edit visualizations directly in PowerPoint with an official add-in S11 S146. |
Integrations and ecosystem
Connected products, exports, APIs, and workflow compatibility.
| Integration or interface | Type | What it enables |
|---|---|---|
| Datawrapper API | API | Programmatically create, edit, and publish charts, and build integrations like CMS embedding S30. |
| PowerPoint add-in | Integration | Create and edit visualizations directly in PowerPoint, with updates synced to Datawrapper S146. |
| PDF and SVG export | Data portability | Download visualizations as print-ready PDFs or vector SVGs for further editing S11. |
| PNG export | Data portability | Export static PNGs for social media or presentations S11. |
Pricing
Pricing and plans
Published plans, free access, trials, credits, and pricing limitations.
| Plan or offer | Verified price and billing | Included | Limits |
|---|---|---|---|
| Free | $0 | Create, publish, embed, and export PNGs without limits S114 | 30-day edit history; attribution shown S114 |
| Pro | $21 per user/month, billed annually, excl. VAT S114 | All Free features, plus PDF/SVG export, no attribution, 90-day edit history S114 | Not established |
| Business | $39 per user/month, billed annually, excl. VAT S114 | All Pro features, plus waterfall/dual-axis charts, fine-grained permissions, 1-year edit history S114 | Not established |
| Enterprise | Contact us S114 | Custom agreements with uptime and support guarantees S114 | Self-hosting of published visualizations, SAML SSO S114 S69 |
| Custom theme add-on | +$499 per month, excl. VAT S114 | Custom themes to fit organization's style guide S114 | $299 per month for each additional theme S114 |
Competition
Competitive landscape
Domains competing for the same organic search demand.
Sampled competitors
| Competitor | First-page appearances | Sampled queries | Average position | Queries observed |
|---|---|---|---|---|
| medium.com | 2 | 1 | 3.5 | chart visualisation |
| tableau.com | 2 | 1 | 6 | chart visualisation |
| inetsoft.com | 1 | 1 | 1 | create visualizations |
| yellowfinbi.com | 1 | 1 | 1 | chart visualisation |
| guides.lib.utexas.edu | 1 | 1 | 2 | create visualizations |
| guides.temple.edu | 1 | 1 | 2 | chart visualisation |
| ibm.com | 1 | 1 | 3 | create visualizations |
| guides.lib.berkeley.edu | 1 | 1 | 4 | create visualizations |
| datastory.tech | 1 | 1 | 5 | create visualizations |
| online.hbs.edu | 1 | 1 | 6 | create visualizations |
Website intelligence — Collected evidence
Customers, testimonials, and first-party review claims
No supporting public-page evidence was collected for this category.
Independent review sources discovered
| Platform | Status | Discovered source |
|---|---|---|
| discovered_not_scraped | https://www.google.com/finance/quote/XOM:NYSE?hl=en&window=MAX |
Backlink profile
Authority and referring-domain signals.
Backlink comparison profile
- Domain rating: 81/100
- Backlinks: 930,661
- Referring domains: 17,261
- Dofollow backlinks: 24.0%
- Dofollow referring domains: 85.0%
| Source DR | Source title | Anchor | Source URL | Target URL |
|---|---|---|---|---|
| 97 | Kroger | "Stores to be sold in Kroger-Albertsons merger \ | Created with Datawrapper" | https://en.wikipedia.org/wiki/Kroger |
| 82 | Berlingske | Få mere at vide om denne udbyder åbner i et nyt vindue | https://www.berlingske.dk/ | https://www.datawrapper.de/privacy/ |
| 67 | SBK Siemens-Betriebskrankenkasse \ | Wir sind auf deiner Seite | www.datawrapper.de/privacy | https://www.sbk.org/ |
| 87 | What causes anxiety? \ | Mental Health Foundation | Datawrapper | https://www.mentalhealth.org.uk/our-work/public-engagement/mental-health-awareness-week/anxiety-report/what-causes-anxiety |
| 79 | Thematic Maps: Types and Use Cases \ | Geoapify | Datawrapper | https://www.geoapify.com/thematic-maps-types-examples/ |
| 41 | Classement Des Cartes Graphiques 2026 • Pause Hardware | Datawrapper | https://pausehardware.com/classement-des-cartes-graphiques/ | https://www.datawrapper.de/_/lr771 |
| 82 | Marktinformatie Wonen \ | NVM | Datawrapper | https://www.nvm.nl/wonen/marktinformatie-wonen/ |
| 61 | Sammenligning: Se forskellen på iPhone Air, 17, 17 Pro og 17 Pro Max | Datawrapper | https://mobilsiden.dk/nyheder/mobiltelefoner/skal-jeg-vaelge-iphone-air-17-17-pro-eller-17-pro-max/ | https://www.datawrapper.de/_/u0sTn |
| 79 | Is College Worth It? - Public Policy Institute of California | significantly lower default and delinquent rates | https://www.ppic.org/publication/is-college-worth-it/ | https://www.datawrapper.de/_/122Vo/ |
| 84 | Una cuarta parte de las estaciones del Meteocat ya han superado la media anual de precipitaciones este año | Datawrapper | https://www.elperiodico.com/es/tiempo/20261010/estaciones-meteocat-lluvias-cataluna-barcelona-granollers-dv-135197943 | https://www.datawrapper.de/_/NoHPx |
Collection decision
The Scout search index remains intentionally excluded from automatic Scout analysis. This Scout traffic model profile costs 5 credits (0.5 cents) and is included in the first comparison run so its usefulness can be judged before the recurring collection is finalized.
AI visibility
Measured ChatGPT and Google AI mentions with cited sources.
AI-assistant referral traffic
- Estimated current generative-AI referral share: 2.2%
| Month | Traffic share | Source |
|---|---|---|
| — | — | All AI assistants |
| — | — | All AI assistants |
| — | — | All AI assistants |
Website intelligence — Collected evidence
Site-stated AI capabilities
No supporting public-page evidence was collected for this category.
These are first-party product claims, not independent measurements of AI-search visibility.
Marketing opportunities
Actions calculated directly from the collected evidence.
| Opportunity | Recommended action | Evidence |
|---|---|---|
| Competitor gap | Review the sampled queries where medium.com appears. | 2 first-page appearances across chart visualisation |
Website intelligence — Collected evidence
Website evidence gaps
- customers: no usable public page was collected; verify whether the site publishes this evidence.
- reviews: no usable public page was collected; verify whether the site publishes this evidence.
- identity: no usable public page was collected; verify whether the site publishes this evidence.
- technical: no usable public page was collected; verify whether the site publishes this evidence.
Website intelligence — Scout synthesis
- The free tier allows creating and embedding interactive charts, maps, and tables, which can serve as a top-of-funnel acquisition channel W28W29.
- The API is free for up to 500 Create, 1,000 Publish, and 3,000 Export operations per month, encouraging developer adoption and integration use cases W144W185.
- The PowerPoint add-in addresses a specific workflow need, potentially attracting presentation-heavy teams W164W170.
- Custom themes are offered at $299 per month per additional theme, presenting an upsell for brand-consistency-focused organizations W46W47.
- The Business plan adds waterfall and dual-axis charts, targeting financial and analytical use cases W51W55W60.
- Academy content, such as tutorials on grouping symbols and API usage, supports SEO for long-tail educational queries W115W181.
Trust and proof
Customers, proof, and reviews
Published proof, customer signals, and review evidence.
Independent reviews
| Platform | Page | How it was found | Note |
|---|---|---|---|
| Capterra | Datawrapper Software Pricing, Alternatives & More 2026 / Capterra | Grounded web search | 4.8 (6) ... Last updated on October 15, 2026 ... Provider data verified by our Software Research team, and reviews moderated by our Reviews Verification team. Learn more ... ### "A hidden gem for journalists and bloggers needing free maps and charts" ... One of my favourite SaaS programs. The workflow is simple, and I am still amazed that the team offer so much value for no cost. Generous free tier with plenty of powerful features. The 'River' section provides plenty of inspiration. If you want |
| Toolradar | Datawrapper Reviews, Pricing & Alternatives (2026) - 4.5/5 | Grounded web search | ## Ratings Across the Web 4.5(16 reviews) Datawrapper holds an aggregate rating of 4.5 out of 5 from 16 reviews across G2 and Capterra, last checked September 17, 2026. G2 10 reviews 4.3/5 Capterra 6 reviews 4.8/5 Ratings aggregated from independent |
| mobilestalk.net | Datawrapper Review, Pricing & Alternatives (2026) / MobilesTalk | Grounded web search | The REST API can create and edit charts and support integrations such as CMS chart viewers and image exports. / / API browser restriction / API calls are intended for server-side scripts because direct browser requests are blocked for security reasons. / |
Customer proof
| Proof type | Named customer or source | Evidence |
|---|---|---|
| Case study | Rabah Kamal | customer case study — in the U.S., that person was Rabah Kamal. (KFF: “We are all-in on Datawrapper” / Datawrapper) |
Independent mentions
- Case Studies / Datawrapper — Find out how newsrooms, corporates and government institutions improve their reports with Datawrapper. ### Journalism professor Adam Marton: “The students don’t have any trouble picking it up.” How Adam
- London City Hall: “Datawrapper has sparked a change” / Datawrapper — Mike needed a tool the staff could work with to create charts their readers would understand. “You might be an economist, but you’re not a developer; you might be an analyst but you’re not a graphics person. I was trying
- Aftenposten: “An article with a chart feels like a better article.” / Datawrapper — Aftenposten’s journalists have created more than 10 Datawrapper charts ... and a quarter of those have created more than 100 charts. What did this newspaper do right? We interviewed ... of editorial tools, Ronny Ruud, to learn which role Datawrapper and
- Investopedia: “Datawrapper is taking our content to the next level” / Datawrapper — ” How Datawrapper keeps 20 years of charts looking beautiful, consistent, and up-to-date. ... you’re managing a household budget or planning for ... , a financial education website, has been trying to demystify those topics for a broad audience since
- The Philadelphia Inquirer: “With Datawrapper, I bet on the right horse.” / Datawrapper — Datawrapper helped John with the switch to digital-first. According to him, the more than 850 visualizations he’s built with this tool since 2015 have five advantages: they’re adaptive, responsive, interactive, quick, and simple.
External links were grounded in one live web search. Search snippets are leads, not independently scraped page content; rejected links remain available in Review evidence.
Company, security, and trust
Ownership, policies, security signals, and public trust evidence.
| Signal | Finding | Source |
|---|---|---|
| Company and ownership | Datawrapper GmbH is a German startup owned by co-founders Mirko Lorenz, Gregor Aisch, and David Kokkelink S114. | S114 |
| Contact and support | Support is available via email at support@datawrapper.de S30. | S30 |
| Legal and privacy | Embedded visualizations are GDPR compliant; IP addresses are processed but not stored S114. | S114 |
| Security and compliance | ISO 27001 certified with yearly audits and penetration tests S11. | S11 |
| Uptime and status page | Custom agreements with uptime guarantees are available for Enterprise plans S114. | S114 |
Documentation and product updates
Help resources, product guidance, and visible changes over time.
| Resource or update | Type | What is available | Date or freshness |
|---|---|---|---|
| Getting started / Datawrapper Developer Docs | Documentation | Learn how to get started using the Datawrapper API. (source) | Not dated |
| How to use the new Python library “datawrapper” to create 34 charts in a few seconds / Datawrapper Blog | Guide | ¡Hola! This is Sergio Sánchez. I wrote a Python package for the new Datawrapper API called datawrapper. (source) | Not dated |
| Pricing / Datawrapper | Changelog | Public product change history. (source) | Not dated |
Not found in the collected public sources: public roadmap, status page, separate help center or knowledge base.
Technical
Technical and delivery signals
Delivery model, platforms, API, data ownership, reliability claims and release activity.
| Signal | Finding | Source |
|---|---|---|
| Delivery model (cloud, self-hosted, desktop, browser extension) | Datawrapper is a web application, with self-hosting options for published visualizations on Enterprise plans S69 S114. | S69 S114 |
| Platforms and apps | Visualizations are responsive on desktop, tablets, and smartphones S11. | S11 |
| API and extensibility (API, SDK, webhooks, MCP, plugins) | Provides a REST API for programmatic chart management, with scoped access tokens S30. | S30 |
| Data ownership and export | Users can export visualizations as PNG, PDF, or SVG S11. | S11 |
| Performance and reliability claims | Not published on the collected pages. | — |
| Release activity | Not published on the collected pages. | — |
Measured infrastructure
Domain, certificate, and hosting signals, measured directly.
| Signal | Finding |
|---|---|
| First archived | 2012-02-26 — web archive |
| TLS certificate | Google Trust Services, valid, expires 2027-01-08 |
| Security headers | HSTS, X-Content-Type-Options |
| Headers not served | CSP, X-Frame-Options, Referrer-Policy |
| Server header | cloudflare |
| Mail handled by | aspmx.l.google.com, alt1.aspmx.l.google.com |
| Nameservers | kai.ns.cloudflare.com, gene.ns.cloudflare.com |
Not measurable: rdap: no RDAP server published for .de. A gap here means the lookup was unavailable, not that the finding is negative.
Technical site audit
A bounded multi-page crawl with page-level issues and URLs.
Scout — Bounded technical crawl
- Pages crawled: 15 of 15 maximum
- Technical health: 92/100
- Critical issues: 0
- Warnings: 24
- Notices: 1
Issues
Crawled pages
| Status | Title | H1s | Words | Response | URL |
|---|---|---|---|---|---|
| 200 | Datawrapper: Create charts, maps, and tables | 2 | 1401 | 776 ms | https://www.datawrapper.de/ |
| 200 | Datawrapper: Create charts, maps, and tables | 2 | 1401 | 1,096 ms | https://www.datawrapper.de/ |
| 200 | Feature Overview \ | Datawrapper | 0 | 597 | 1,081 ms |
| 200 | Learn \ | Datawrapper | 0 | 953 | 806 ms |
| 200 | Pricing \ | Datawrapper | 0 | 2721 | 910 ms |
| 200 | Contact Us \ | Datawrapper | 0 | 228 | 737 ms |
| 200 | How to get a custom design theme for your visualizations \ | Datawrapper Academy | 1 | 1664 | 1,121 ms |
| 200 | How to publish & unpublish your visualizations \ | Datawrapper Academy | 1 | 712 | 902 ms |
| 200 | How to collaborate with others on visualizations \ | Datawrapper Academy | 1 | 527 | 1,064 ms |
| 200 | How to see, search, and sort visualization in your Archive \ | Datawrapper Academy | 1 | 1027 | 1,061 ms |
| 200 | Workspaces: A separate space for every context you work in \ | Datawrapper Academy | 1 | 1077 | 897 ms |
| 200 | Get support \ | Datawrapper | 0 | 228 | 728 ms |
| 200 | Charts \ | Datawrapper | 0 | 376 | 723 ms |
| 200 | Maps \ | Datawrapper | 0 | 455 | 1,044 ms |
| 200 | Tables \ | Datawrapper | 0 | 321 | 887 ms |
This is a bounded Scout crawl. Core Web Vitals and Lighthouse scores are not claimed unless a dedicated performance audit is connected.
Search Console and Analytics
First-party search and behavioral data connection state.
Modeled acquisition channels
| Channel | Estimated share |
|---|---|
| direct | 56.2% |
| search | 30.0% |
| search organic | 30.0% |
| search paid | 0.0% |
| social | 3.2% |
| social organic | 3.2% |
| social paid | 0.0% |
| referrals | 7.2% |
| paid referrals | 0.0% |
| 1.3% | |
| gen ai | 2.2% |
| affiliate | 0.0% |
| other | 0.0% |
First-party connections
| Integration | Status | Data available after connection |
|---|---|---|
| Google Search Console | Not connected | Clicks, impressions, CTR, average position, queries, pages, countries, and devices |
| Google Analytics | Not connected | Organic sessions, engagement, landing pages, conversions, geography, and devices |
No first-party Search Console or Analytics numbers are shown until the site owner authorizes the corresponding Google account. Scout traffic model values above are modeled estimates, not private analytics totals.
Limits and method
Limitations and open questions
Known constraints and missing evidence from the collected pages.
The collected pages do not mention specific competitors. Evidence gaps include lack of detailed performance metrics, release dates, and independent review ratings. Open questions remain about the full scope of Enterprise features and custom theme pricing details.
Sources, method, and limitations
Evidence inventory, collection method, provider use, and constraints.
This report is based on 14 of 15 collected pages from datawrapper.de, including product, pricing, developer documentation, and case study pages. Evidence was gathered via static and rendered page collection, with external proof search for verification. Limitations include missing pages and potential outdated information; claims are cited to specific sources.
- Official Websitehttps://www.datawrapper.de/Verified
- Official Websitehttps://www.datawrapper.de/about-usVerified
- Official Websitehttps://www.datawrapper.de/featuresVerified
- Documentationhttps://www.datawrapper.de/developer/getting-startedVerified
- Pricing Pagehttps://www.datawrapper.de/pricing#i-have-a-question-that-isn-t-answered-hereVerified
- Pricing Pagehttps://www.datawrapper.de/blog/datawrapper-python-packageVerified
- Pricing Pagehttps://www.datawrapper.de/blog/new-pricing-on-dec-1-2019Verified
- Pricing Pagehttps://www.datawrapper.de/blog/weekly46-consumer-price-indexVerified
- Official Websitehttps://www.datawrapper.de/blog/new-datawrapper-features-to-cover-electionsVerified
- Official Websitehttps://www.datawrapper.de/blog/team-feature-automatic-image-publishingVerified
- Documentationhttps://www.datawrapper.de/powerpoint-integrationVerified
- Documentationhttps://www.datawrapper.de/blog/datawrapper-hiring-backend-developerVerified
- Documentationhttps://www.datawrapper.de/blog/datawrapper-hiring-vector-export-developerVerified
- Documentationhttps://www.datawrapper.de/blog/hiring-data-visualization-developerVerified
- Review Sitehttps://www.capterra.com/p/164214/Datawrapper/Verified
- Review Sitehttps://toolradar.com/tools/datawrapperVerified
- Articlehttps://www.datawrapper.de/case-studies/kffVerified
- Articlehttps://www.datawrapper.de/case-studies/new-americaVerified
- Articlehttps://www.datawrapper.de/case-studiesVerified
- Articlehttps://www.datawrapper.de/case-studies/london-city-hallVerified
- Articlehttps://www.datawrapper.de/case-studies/aftenpostenVerified
- Articlehttps://www.datawrapper.de/case-studies/investopediaVerified
- Review Sitehttps://mobilestalk.net/software/datawrapper/Verified
- Articlehttps://www.datawrapper.de/case-studies/the-philadelphia-inquirerVerified