Overview
Summary
The useful answer before the supporting detail.
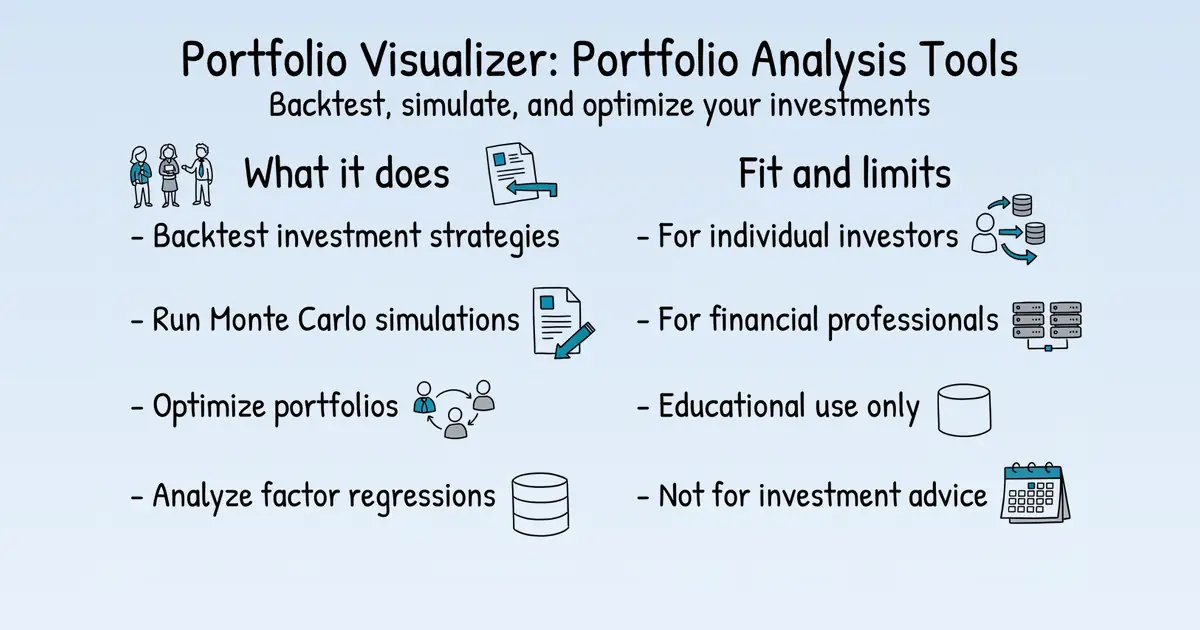
Portfolio Visualizer is an online platform offering portfolio analysis tools for backtesting, Monte Carlo simulation, tactical asset allocation, and optimization S1. It serves investors and financial professionals who need to simulate investment strategies using historical data and explore factor regressions, correlations, and efficient frontiers S1. The practical value lies in its educational and illustrative analysis capabilities, though outputs are hypothetical and not indicative of future outcomes S1.
Product identity and positioning
Name, category, positioning, audience, and first-party claims.
- Identity: Portfolio Visualizer, an online portfolio analysis tool S1.
- Core purpose: Simulate investment strategies and analyze portfolios using historical data S1.
- Intended users: Investors and financial professionals seeking educational analysis S1.
- Product scope: A web application offering backtesting, Monte Carlo simulation, optimization, and investment analysis tools S1.
- Positioning: Provided for educational and illustrative purposes only S1.
- Claimed distinction: Not established in the collected sources.
Use cases and audiences
Who the product serves and the jobs it is designed to handle.
| Audience | Practical use case |
|---|---|
| Individual investors | Backtest investment strategies using historical data S1. |
| Financial professionals | Explore factor regressions, correlations, and efficient frontiers for investment analysis S1. |
| Educational users | Use the free tier for personal and educational portfolio analysis S22. |
| Commercial users | Use Pro plan for commercial purposes with advanced features S22. |
Traffic and search
SEO analysis
Collected Oct 22, 2026portfoliovisualizer.com: an estimated 487,178 total monthly visits and about 71,304 monthly organic visits across 1,106 ranking keywords. Scout crawled 15 pages and measured a technical health score of 98/100.
Search summary
The useful answer before the supporting detail.
Portfolio Visualizer provides online portfolio analysis tools for backtesting, Monte Carlo simulation, tactical asset allocation and optimization, and investment analysis tools for exploring factor regressions, correlations and efficient frontiers. portfoliovisualizer.com: an estimated 487,178 total monthly visits and about 71,304 monthly organic visits across 1,106 ranking keywords. Scout crawled 15 pages and measured a technical health score of 98/100.
- Total traffic (modeled): 487,178 monthly visits across all channels.
- Organic search traffic (estimated): 71,304 monthly visits from search.
- Strongest sampled ranking: backtest at position 1.
- Leading page in the collected evidence: https://www.portfoliovisualizer.com/backtest-portfolio.
- Closest measured organic competitor: reddit.com, appearing 2 times in the sampled first-page SERPs.
- Technical crawl: 15 pages, health score 98/100.
Website intelligence — Collected evidence
Company identity and positioning
| Page type | Evidence | Source |
|---|---|---|
| other | Portfolio Visualizer provides online portfolio analysis tools for backtesting, Monte Carlo simulation, tactical asset allocation and optimization, and investment analysis tools for exploring factor regressions, correlations and efficient frontiers. | https://portfoliovisualizer.com/ |
| other | Investments involve risk, including possible loss of principal. You remain solely responsible for your investment decisions. | https://portfoliovisualizer.com/ |
| other | Portfolio backtesting is a process of simulating an investment strategy using historical data. It can help you and test how well a portfolio would have performed in the past, and to analyse risk and return. | https://portfoliovisualizer.com/ |
| other | Tactical allocation models based on moving averages, momentum, market valuation, volatility targeting, or risk management strategies for improved risk-adjusted returns. | https://portfoliovisualizer.com/ |
| other | In the dynamic world of exchange-traded funds (ETFs), a group has carved out a legacy of capturing the attention of investors for decades. Even casual investors may be familiar with some of the most popular ETFs by their tickers alone. | https://portfoliovisualizer.com/ |
| other | Nothing is ever certain in investing. There are some investment principles, though, that tend to hold true in many environments. For example, if you want higher returns, the trade-off is usually accepting more risk and volatility. | https://portfoliovisualizer.com/ |
| other | ETFs have become an integral part of modern investing strategies. This success isn’t a surprise because ETFs have a lot going for them: lower costs, transparency, and the ability to buy and sell during the trading day. | https://portfoliovisualizer.com/ |
| other | ETFs burst onto the scene about 30 years ago and the investing landscape hasn’t been the same since. At a fundamental level, ETFs leveled the playing field with access, fees, and precision once reserved for large institutions. | https://portfoliovisualizer.com/ |
| other | Portfolio Visualizer is provided strictly for educational and illustrative purposes only. | https://portfoliovisualizer.com/ |
| other | For educational and illustrative purposes only. Portfolio Visualizer is not registered with the SEC, FINRA, FCA, ESMA, or any other regulator and does not provide investment, legal, accounting, or tax advice. Past performance and model results are hypothetical and not guarantees of future outcomes. Investments involve risk, including possible loss of principal. By using this site, you agree to our [Terms of Service](terms-of-service) and [Privacy Policy](privacy-policy). | https://portfoliovisualizer.com/ |
| other | Investments involve risk, including possible loss of principal. You remain solely responsible for your investment decisions. | https://portfoliovisualizer.com/analysis |
| other | Select Solutions For | https://portfoliovisualizer.com/analysis |
Website intelligence — Scout synthesis
- First-party claims: Portfolio Visualizer is an educational tool for portfolio backtesting, Monte Carlo simulation, factor regression, and tactical allocation modeling W20W58W60W64W69. It explicitly states it is "Educational only. Not investment advice" and that all outputs are hypothetical W2W4. The site is operated by SRL, which "does not provide investment, legal, accounting, or tax advice and is not registered with any regulator" W3.
- First-party claims: The homepage features a "Market Monitor - Top 5 Lazy Portfolios" with YTD, 1Y, and 3Y returns for portfolios like Mebane Faber Ivy Portfolio, Bogleheads Three Funds, and Bill Bernstein No Brainer W10W13W14W17.
- First-party claims: The site discloses affiliate relationships: "From time to time we feature, discuss, or link to instruments, funds, platforms, or services issued or sponsored by our owners, affiliates, partners, or advertisers. We may receive compensation" W6.
- Scout inference: The homepage positions Portfolio Visualizer as a comprehensive analysis platform, linking to tools for backtesting, factor analysis, fund screening, Monte Carlo simulation, and portfolio optimization W58W60W62W64W66.
- Scout inference: The pricing page indicates a freemium model with paid tiers (Basic/Pro) that unlock features like larger portfolios, YTD results, tactical model signals, and PDF reports W36W47W48.
Domain performance
Modeled total traffic, six-month trend, engagement, countries, and domain identity.
Total website traffic
| Month | Modeled visits |
|---|---|
| 2026-04 | 484,988 |
| 2026-05 | 559,997 |
| 2026-06 | 542,928 |
| 2026-07 | 506,558 |
| 2026-08 | 507,759 |
| 2026-09 | 487,178 |
Top visitor countries
| Country | Name | Traffic share |
|---|---|---|
| US | United States | 58.9% |
| CA | Canada | 10.5% |
| TW | Taiwan | 4.8% |
| KR | Korea, Republic of | 4.2% |
| IT | Italy | 2.4% |
Domain identity
| Signal | Value |
|---|---|
| Registered | Apr 1, 2013 |
| Last changed | Aug 5, 2026 |
| Expires | Apr 1, 2028 |
| WHOIS server | whois.verisign-grs.com |
| DNSSEC | Not signed |
| Nameservers | AUTUMN.NS.CLOUDFLARE.COM, NORMAN.NS.CLOUDFLARE.COM |
Organic keywords
Top keywords and an independent Google result page.
Top organic keywords
| Keyword | Volume | CPC | Estimated value |
|---|---|---|---|
| portfolio visualizer | 17,810 | $4.09 | $12,830 |
| monte carlo simulation | 91,970 | $3.33 | $4,510 |
| backtest portfolio | 1,570 | $4.07 | $970 |
| portfoliovisualizer | 1,210 | $4.60 | $840 |
| portfolio analyzer | 1,610 | $12.55 | $830 |
Independent Google result page
Query: backtest
| Position | Title | URL | Description |
|---|---|---|---|
| 1 | Backtest Portfolio Asset Allocation | https://www.portfoliovisualizer.com/backtest-portfolio | This portfolio backtesting tool allows you to construct one or more portfolios based on the selected mutual funds, ETFs, and stocks. |
| 2 | Backtest Any Trading Strategy on Real Market Data | https://fxreplay.com/backtest | Manual backtesting is the process of personally replaying historical market data and placing trades as if in real time — without automation or scripting. |
| 3 | Backtesting | https://en.wikipedia.org/wiki/Backtesting | Backtesting is a term used in modeling to refer to testing a predictive model on historical data. Backtesting is a type of retrodiction, and a special type ... |
| 4 | testfolio: Portfolio Backtester for ETFs and Asset Allocation | https://testfol.io/ | Backtest portfolios, compare asset allocations, model rebalancing and cashflows, and analyze historical risk and return with testfolio. |
| 5 | Backtesting in Trading: Definition, Benefits, and Limitations | https://www.investopedia.com/terms/b/backtesting.asp | Backtesting uses historical data to estimate how effective a trading strategy might be without the need for real-time execution or financial risk. |
| 6 | Backtesting trading strategies | https://www.multicharts.com/features/strategy-backtesting/ | Backtesting software simulates your strategy on historical data and provides a backtesting report, which allows you to conduct proper trading system analysis. |
| 7 | What is Backtesting? How to Backtest a Trading Strategy - IG | https://www.ig.com/en/trading-strategies/what-is-backtesting-and-how-do-you-backtest-a-trading-strategy--220426 | Backtesting is a way of analysing the potential performance of a trading strategy by applying it to sets of real-world, historical data. |
| 8 | Free Backtesting Software for Trading Strategies | https://strategytune.com/app | The StrategyTune backtesting app — replay historical markets tick-by-tick, place trades, and test strategies on 70+ instruments. Free, runs in the browser, ... |
| 9 | Free Forex Backtesting Tool – Test Strategies on Historical ... | https://www.myfxbook.com/backtests | Backtest your forex trading strategies for free using over 20 years of historical market data. Replay price movements, use synchronized ... |
| 10 | Portfolio Backtest Explained with Example | https://www.fe.training/free-resources/portfolio-management/portfolio-backtest/ | Portfolio backtesting is the process of reviewing how an investment or trading strategy would have performed in the past. |
Important pages
Pages earning the most estimated search traffic in the sample.
| URL | Ranking keywords | Estimated traffic | Best position |
|---|---|---|---|
| https://www.portfoliovisualizer.com/backtest-portfolio | 11 | 2,964 | 1 |
| https://www.portfoliovisualizer.com/asset-correlations | 3 | 149 | 1 |
| https://www.portfoliovisualizer.com/ | 3 | 79 | 1 |
| https://www.portfoliovisualizer.com/asset-class-correlations | 2 | 27.4 | 1 |
| https://www.portfoliovisualizer.com/asset-liability-modeling | 1 | 9.1 | 1 |
Website intelligence — Collected evidence
Prioritized website intelligence pages
| Type | Page | Words | Change | URL |
|---|---|---|---|---|
| other | Portfolio Visualizer | 929 | new | https://portfoliovisualizer.com/ |
| pricing | Subscription Plans and Pricing | 674 | new | https://portfoliovisualizer.com/pricing |
| other | Portfolio Visualizer Analysis Tools | 3,348 | new | https://portfoliovisualizer.com/analysis |
Features
No supporting public-page evidence was collected for this category.
Pricing and plans
| Page type | Evidence | Source |
|---|---|---|
| pricing | Subscription Plans and Pricing | https://portfoliovisualizer.com/pricing |
| pricing | [Start Trial](sign-up) | https://portfoliovisualizer.com/pricing |
| pricing | (1) Basic and pro plans support up to 150 assets with YTD results, free tier supports portfolios with up to 15 assets with limited history and excludes the current month-to-date results. | https://portfoliovisualizer.com/pricing |
| pricing | (3) Basic plan allows 50 portfolio models to be saved and pro plan enables 150 portfolio models. | https://portfoliovisualizer.com/pricing |
Integrations and supported platforms
No supporting public-page evidence was collected for this category.
Product and company updates
No supporting public-page evidence was collected for this category.
Website intelligence — Scout synthesis
- First-party claims: The homepage (portfoliovisualizer.com) is the primary entry point, featuring tools and lazy portfolio performance data W1W10W13.
- First-party claims: The pricing page (portfoliovisualizer.com/pricing) details subscription plans and features W25W35.
- First-party claims: The analysis tools page (portfoliovisualizer.com/analysis) lists all available tools, including Backtest Asset Allocation, Backtest Portfolio, Factor Regression, Fund Screener, Monte Carlo Simulation, Efficient Frontier, and Tactical Asset Allocation W58W60W62W64W66W69.
- Scout inference: The analysis page serves as a hub for the site's core functionality, with deep links to individual tools W59W61W63W65W67W70.
Rank tracking
Persistent keyword baselines and position movement.
This analysis created the first position baseline at 2026-10-22T06:02:05.413Z. Movement appears after the next fresh analysis using the same location and language.
Features
Features and capabilities
Core functions and evidence-backed product capabilities.
| Capability | What it does |
|---|---|
| Backtesting | Simulates an investment strategy using historical data S1. |
| Monte Carlo simulation | Models potential portfolio outcomes through simulation S1. |
| Tactical asset allocation | Applies models based on moving averages, momentum, market valuation, volatility targeting, or risk management S1. |
| Portfolio optimization | Optimizes portfolios, with free tier supporting up to 15 assets S22. |
| Investment analysis | Explores factor regressions, correlations, and efficient frontiers S1. |
| Custom return series | Create and import custom return series for use as portfolio assets and benchmarks S22. |
| Export | Export results to Excel, CSV, or PDF (on paid plans) S22. |
Integrations and ecosystem
Connected products, exports, APIs, and workflow compatibility.
Pricing
Pricing and plans
Published plans, free access, trials, credits, and pricing limitations.
| Plan or offer | Verified price and billing | Included | Limits |
|---|---|---|---|
| Free | $0 S22 | Backtesting, Monte Carlo, portfolio optimization for up to 15 assets with limited history S22 | Personal and educational use; no saving or export S22 |
| Basic | $30/month, billed annually S22 | Up to 150 assets with YTD results; 50 saved portfolio models; Excel, CSV, PDF export S22 | Personal and educational use S22 |
| Pro | $55/month, billed annually S22 | Up to 150 assets; 150 saved portfolio models; custom data series, fees, capital market and tax assumptions, branded PDF reports, team synchronization S22 | Personal and commercial use S22 |
| Trial | Free trial offered on Basic and Pro S22 | Not established | Length not stated S22 |
Competition
Competitive landscape
Domains competing for the same organic search demand.
Sampled competitors
| Competitor | First-page appearances | Sampled queries | Average position | Queries observed |
|---|---|---|---|---|
| reddit.com | 2 | 2 | 2 | backtest, backtest portfolio |
| avatrade.com | 1 | 1 | 1 | backtest |
| composer.trade | 1 | 1 | 2 | backtest |
| medium.com | 1 | 1 | 2 | backtest portfolio |
| site.financialmodelingprep.com | 1 | 1 | 3 | backtest portfolio |
| tradezella.com | 1 | 1 | 4 | backtest |
| etf-portfolio.com | 1 | 1 | 4 | backtest portfolio |
| fxreplay.com | 1 | 1 | 5 | backtest |
| portal.tradebrains.in | 1 | 1 | 5 | backtest portfolio |
| uk.mathworks.com | 1 | 1 | 6 | backtest |
Website intelligence — Collected evidence
Customers, testimonials, and first-party review claims
No supporting public-page evidence was collected for this category.
Independent review sources discovered
No links to supported independent review platforms were discovered on the collected pages.
Website intelligence — Scout synthesis
- First-party claims: The homepage compares lazy portfolios (e.g., Mebane Faber Ivy Portfolio, Bogleheads Three Funds, Bogleheads Four Funds, Growth Portfolio, Bill Bernstein No Brainer) against a benchmark (SPY) W13W14W15W16W17.
- Scout inference: The site positions itself as a tool for comparing portfolio strategies against common benchmarks, which is a differentiator in the investment analysis space W13W14.
AI visibility
Measured ChatGPT and Google AI mentions with cited sources.
AI-assistant referral traffic
- Estimated current generative-AI referral share: 1.1%
| Month | Traffic share | Source |
|---|---|---|
| — | — | All AI assistants |
| — | — | All AI assistants |
Website intelligence — Collected evidence
Site-stated AI capabilities
No supporting public-page evidence was collected for this category.
These are first-party product claims, not independent measurements of AI-search visibility.
Marketing opportunities
Actions calculated directly from the collected evidence.
| Opportunity | Recommended action | Evidence |
|---|---|---|
| Competitor gap | Review the sampled queries where reddit.com appears. | 2 first-page appearances across backtest, backtest portfolio |
Website intelligence — Collected evidence
Website evidence gaps
- features: no usable public page was collected; verify whether the site publishes this evidence.
- integrations: no usable public page was collected; verify whether the site publishes this evidence.
- customers: no usable public page was collected; verify whether the site publishes this evidence.
- reviews: no usable public page was collected; verify whether the site publishes this evidence.
- changes: no usable public page was collected; verify whether the site publishes this evidence.
- identity: no usable public page was collected; verify whether the site publishes this evidence.
- technical: no usable public page was collected; verify whether the site publishes this evidence.
Website intelligence — Scout synthesis
- First-party claims: The homepage highlights "Most Popular Analysis Tools" and links to "See all the Analytics Tools" W19W21.
- First-party claims: The analysis page lists tools across categories: Portfolio Construction, Performance Attribution, Model Laboratory, Financial Planning, and Research & Insights W57.
- First-party claims: The pricing page lists features such as "Save and Import Portfolios", "Customized PDF Reports", "Configurable Asset Backfills", and "Team Member Account Synchronization" W39W42W41W45.
- Scout inference: The site can market its comprehensive toolset and premium features (e.g., PDF reports, team sync) to professional and advanced retail investors W42W45.
Trust and proof
Customers, proof, and reviews
Published proof, customer signals, and review evidence.
Independent reviews
No citation-grounded independent review links were found.
Customer proof
No named customers, testimonials, or customer case studies were found.
Independent mentions
- Portfolio Visualizer — 5.1 Million Annual Visits ... 100 + Countries ... 30 Global Markets ... 187,650 Securities ... Portfolio backtesting is a process of simulating an investment strategy using historical data. It can help you and test how well a portfolio would have performed in the past, and to analyse risk and return. ... Create and compare different portfolio models and align investments with financial goals. Portfolio Optimization Model the probability of different investment outcomes and better understand the
- Portfolio Visualizer Documentation — you will see a "Save Portfolio" link under the portfolio asset allocation section of the results. Similarly, if the portfolio is already saved ... to the saved portfolio name. The results section for Monte Carlo simulations, portfolio optimization, and
- Market Dashboard — Market Dashboard Countries Asset Classes Sectors Watchlist Global Markets ... / Metric / Portfolio / / --- / --- / / Start Balance / / / End Balance / / / Annualized Return / / / Annualized Volatility / / / Sharpe Ratio / / / Max. Drawdown / /
- Gallery of Examples — This gallery of examples highlights typical use cases of the different tools provided by Portfolio Visualizer. ... 1. Portfolio Modeling and Analysis a. Backtest Asset Class Allocation b. Portfolio Model Performance 2. Monte Carlo Simulations a. Monte Carlo Simulation b. Monte Carlo Simulation Using Forward Looking Capital Market Expectations c. Financial Goals Planning 3. Portfolio Optimization ... a. Efficient Frontier b. Resampled Efficient Frontier c. Mean Variance Optimization d. Risk Parit
- Login to Portfolio Visualizer — # Login to Portfolio Visualizer Please enter your login information to sign in below. If you do not already have an account, you can sign up for a free trial to enable all features. ## Login Information Email Password Stay signed in on this device
- Efficient Frontier — This tool uses mean-variance optimization to calculate and plot the efficient frontier for the specified asset classes, mutual funds, ETFs, or stocks based on historical returns or forward-looking capital market assumptions The efficient frontier shows the set of optimal portfolios that provide the best possible expected return for the level of risk in the portfolio. Monte Carlo method can be used for more robust optimization that resamples the optimization inputs in order to mitigate
- Asset Liability Modeling — The asset liability modeling (ALM) tool analyzes the available assets, required future contributions, and strategic asset allocation against the expected future liabilities. The following simulation models are supported for portfolio returns:
- Financial Goals — This Monte Carlo simulation supports planning for financial goals and related spending. Multiple cashflow goals can be applied based on different life stages ... and the simulation supports the use of a linear glide path to transition from a career stage
External links were grounded in one live web search. Search snippets are leads, not independently scraped page content; rejected links remain available in Review evidence.
Company, security, and trust
Ownership, policies, security signals, and public trust evidence.
| Signal | Finding | Source |
|---|---|---|
| Company and ownership | Not published on the collected pages. | — |
| Contact and support | When you activate an account, you are providing your consent to occasionally receive information from us. In each communication from us you will have the opportunity to unsubscribe from further communications; alternativ | source |
| Legal and privacy | By clicking I Agree or by using this software, you confirm that you have read, understood, and agree to be bound by the Terms of Service, Privacy Policy, Disclaimer, Global Disclosures, and Partners and Affiliates. | source |
| Security and compliance | Not published on the collected pages. | — |
| Uptime and status page | Not published on the collected pages. | — |
| Domain registered | 2013-04-01 | — |
| Domain expires | 2028-04-01 | — |
Not found on the collected pages: company and ownership, security and compliance, uptime and status page. This only means Scout did not find it on the pages it read; it says nothing about the company itself.
Documentation and product updates
Help resources, product guidance, and visible changes over time.
| Resource or update | Type | What is available | Date or freshness |
|---|---|---|---|
| Contact and support | Support | Public contact and support channel. (source) | Not dated |
Not found in the collected public sources: public roadmap, changelog or release notes, status page, separate help center or knowledge base.
Technical
Technical and delivery signals
Delivery model, platforms, API, data ownership, reliability claims and release activity.
| Signal | Finding | Source |
|---|---|---|
| Delivery model (cloud, self-hosted, desktop, browser extension) | Web application S1. | S1 |
| Platforms and apps | Web platform S1. | S1 |
| API and extensibility (API, SDK, webhooks, MCP, plugins) | Not published on the collected pages. | — |
| Data ownership and export | Export to Excel, CSV, PDF on paid plans S22. | S22 |
| Performance and reliability claims | Not published on the collected pages. | — |
| Release activity | Not published on the collected pages. | — |
Measured infrastructure
Domain, certificate, and hosting signals, measured directly.
| Signal | Finding |
|---|---|
| Domain registered | 2013-04-01 — Cloudflare, Inc. |
| Domain expires | 2028-04-01 |
| TLS certificate | Amazon, valid, expires 2027-03-19 |
| Security headers | HSTS, CSP, X-Content-Type-Options |
| Headers not served | X-Frame-Options, Referrer-Policy |
| Server header | nginx |
| Mail handled by | aspmx.l.google.com, alt2.aspmx.l.google.com |
| Nameservers | norman.ns.cloudflare.com, autumn.ns.cloudflare.com |
Not measurable: wayback: rate limited by archive.org, ladder stopped after 1 probe(s). A gap here means the lookup was unavailable, not that the finding is negative.
Technical site audit
A bounded multi-page crawl with page-level issues and URLs.
Scout — Bounded technical crawl
- Pages crawled: 15 of 15 maximum
- Technical health: 98/100
- Critical issues: 0
- Warnings: 4
- Notices: 8
Issues
| Severity | Issue | Value | Affected URL |
|---|---|---|---|
| notice | Meta description length should be reviewed | 248 | https://portfoliovisualizer.com/ |
| warning | Page should have one primary H1 | 0 | https://portfoliovisualizer.com/ |
| notice | Meta description length should be reviewed | 248 | https://portfoliovisualizer.com/analysis |
| warning | Page should have one primary H1 | 0 | https://portfoliovisualizer.com/markets |
| notice | Meta description length should be reviewed | 46 | https://portfoliovisualizer.com/faq |
| notice | Meta description length should be reviewed | 29 | https://portfoliovisualizer.com/login?loginTarget=https://portfoliovisualizer.com/manage-settings |
| notice | Meta description length should be reviewed | 27 | https://portfoliovisualizer.com/manager-performance |
| notice | Meta description length should be reviewed | 218 | https://portfoliovisualizer.com/optimize-portfolio |
| notice | Meta description length should be reviewed | 38 | https://portfoliovisualizer.com/black-litterman-model |
| notice | Meta description length should be reviewed | 39 | https://portfoliovisualizer.com/fund-screener |
| warning | Duplicate meta description in audit sample | 2 | https://portfoliovisualizer.com/ |
| warning | Duplicate meta description in audit sample | 2 | https://portfoliovisualizer.com/analysis |
Crawled pages
This is a bounded Scout crawl. Core Web Vitals and Lighthouse scores are not claimed unless a dedicated performance audit is connected.
Search Console and Analytics
First-party search and behavioral data connection state.
Modeled acquisition channels
| Channel | Estimated share |
|---|---|
| direct | 57.5% |
| search | 32.8% |
| search organic | 32.8% |
| search paid | 0.0% |
| social | 4.5% |
| social organic | 4.5% |
| social paid | 0.0% |
| referrals | 3.2% |
| paid referrals | 0.1% |
| 0.8% | |
| gen ai | 1.1% |
| affiliate | 0.0% |
| other | 0.0% |
First-party connections
| Integration | Status | Data available after connection |
|---|---|---|
| Google Search Console | Not connected | Clicks, impressions, CTR, average position, queries, pages, countries, and devices |
| Google Analytics | Not connected | Organic sessions, engagement, landing pages, conversions, geography, and devices |
No first-party Search Console or Analytics numbers are shown until the site owner authorizes the corresponding Google account. Scout traffic model values above are modeled estimates, not private analytics totals.
Limits and method
Limitations and open questions
Known constraints and missing evidence from the collected pages.
The collected pages do not mention any competitors. Evidence gaps include lack of customer reviews, API documentation, and detailed feature descriptions beyond the homepage. Open questions include the exact trial length and any annual billing details for the Pro plan beyond the monthly equivalent.
Sources, method, and limitations
Evidence inventory, collection method, provider use, and constraints.
This report is based on 5 collected pages from portfoliovisualizer.com, including the homepage, pricing, privacy policy, terms of service, and contact page. The external proof search was completed but no verification requests were made. Coverage is limited to public pages; no customer reviews or third-party integrations were documented.
- Official Websitehttps://portfoliovisualizer.com/Verified
- Pricing Pagehttps://portfoliovisualizer.com/pricingVerified
- Official Websitehttps://portfoliovisualizer.com/privacy-policyVerified
- Official Websitehttps://portfoliovisualizer.com/terms-of-serviceVerified
- Official Websitehttps://portfoliovisualizer.com/contactVerified
- Articlehttps://www.portfoliovisualizer.com/Verified
- Articlehttps://www.portfoliovisualizer.com/faqVerified
- Articlehttps://www.portfoliovisualizer.com/marketsVerified
- Articlehttps://legacy.portfoliovisualizer.com/examplesVerified
- Articlehttps://www.portfoliovisualizer.com/login?loginTarget=www.portfoliovisualizer.com%2FpreferencesVerified
- Articlehttps://www.portfoliovisualizer.com/efficient-frontierVerified
- Articlehttps://www.portfoliovisualizer.com/asset-liability-modelingVerified
- Articlehttps://www.portfoliovisualizer.com/financial-goalsVerified
- Articlehttps://portfoliovisualizer.com/manager-performanceVerified
- Articlehttps://www.portfoliovisualizer.com/fund-rankingsVerified