3.0k stars · PostgreSQL licence · v3.6.2 (2026-06-05), read from /releases/latest; the date showed no year and falls in the past, so 2026 · Track this in Scout
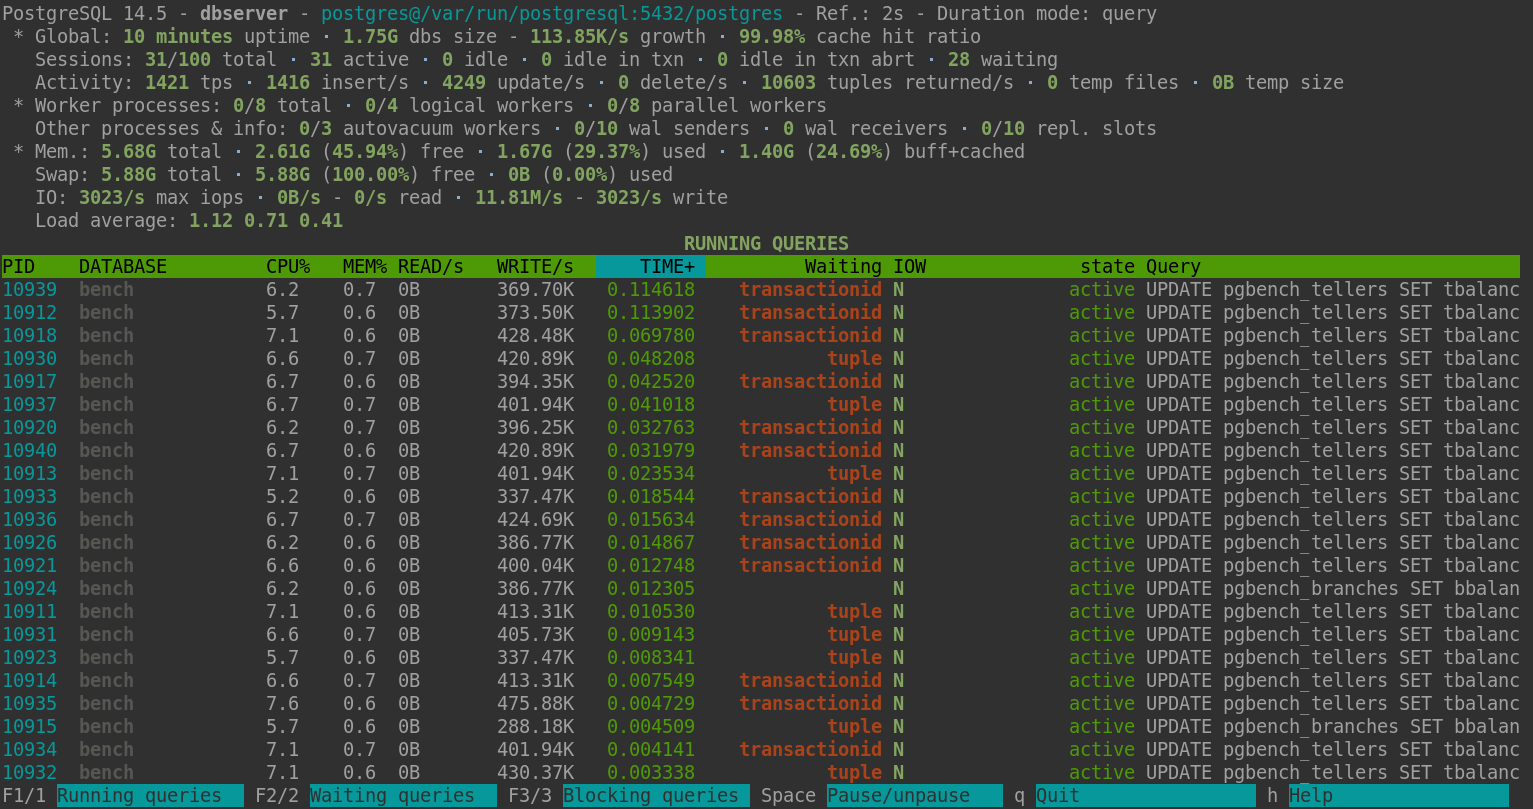
A top-like terminal screen showing every query a PostgreSQL server is running right now, with the ability to cancel one.
▶Repo detailsthe review · specs · pros & cons · install
What it is
A terminal program in the style of top, the standard tool for watching what a computer is doing. It connects to PostgreSQL and refreshes a list of active queries, showing the user, the database, the duration, the state, whether a query is blocked by another one, and read and write activity. It can cancel or terminate a query from the same screen, and it can record what it saw to a CSV file for later.What it is good for. Anyone who runs their own database and has had a slow afternoon with no explanation. The problem it removes is the delay between something going wrong and knowing what is wrong. pgBadger from Edition 18 reads yesterday's log and tells you which queries are usually slow. This is the other half: it tells you what is happening this minute, including the query that is holding a lock and stopping everything else. Being able to end that one query from the same screen is often the whole fix.
- It shows waiting and blocking clearly, which is the single most useful thing when a site has stopped rather than slowed.
- You can cancel or kill a query without opening a second connection and looking up its number.
- The PostgreSQL licence is as permissive as MIT, and it is packaged for Debian and Ubuntu already.
- It shows you now and nothing else. There is no history unless you record it to a file yourself.
- Without a superuser account it runs in a reduced mode and hides some of the most useful columns.
- It is a terminal program, so it is a tool for you and not a dashboard for anybody else.
- lesovsky/pgcenter
Covers the same live view and adds configuration editing and log reading, with a wider set of statistics screens.
Track this in Scout - powa-team/powa
Records statistics over time in the database itself and draws them, so it answers 'last Tuesday' where this answers 'right now'.
Track this in Scout  okbob/pspg
Not a monitor at all: it makes the tables your normal PostgreSQL client prints readable, with frozen headings and search.
Track this in Scout
# Debian or Ubuntu:
sudo apt install pg-activity
# Or with pipx, which keeps it out of your system Python:
pipx install "pg_activity[psycopg]"
# Or in a virtual environment:
python3 -m venv venv
source venv/bin/activate
pip install "pg_activity[psycopg]"
# Watch a local database:
sudo -u postgres pg_activity -U postgres
# Watch a remote one:
pg_activity -h your-server -p 5432 -U postgres -d grasppy