866 stars · BSD-3-Clause · v6.0.0, read from /releases/latest, shown as '15 Sep' with no year and therefore 15 September 2026. NOTE: the README's production instructions still say git checkout v5.0.0, and both figures are printed in the edition. Code pushed 27 August 2026, proved via ungh.cc; default branch is master · Track this in Scout
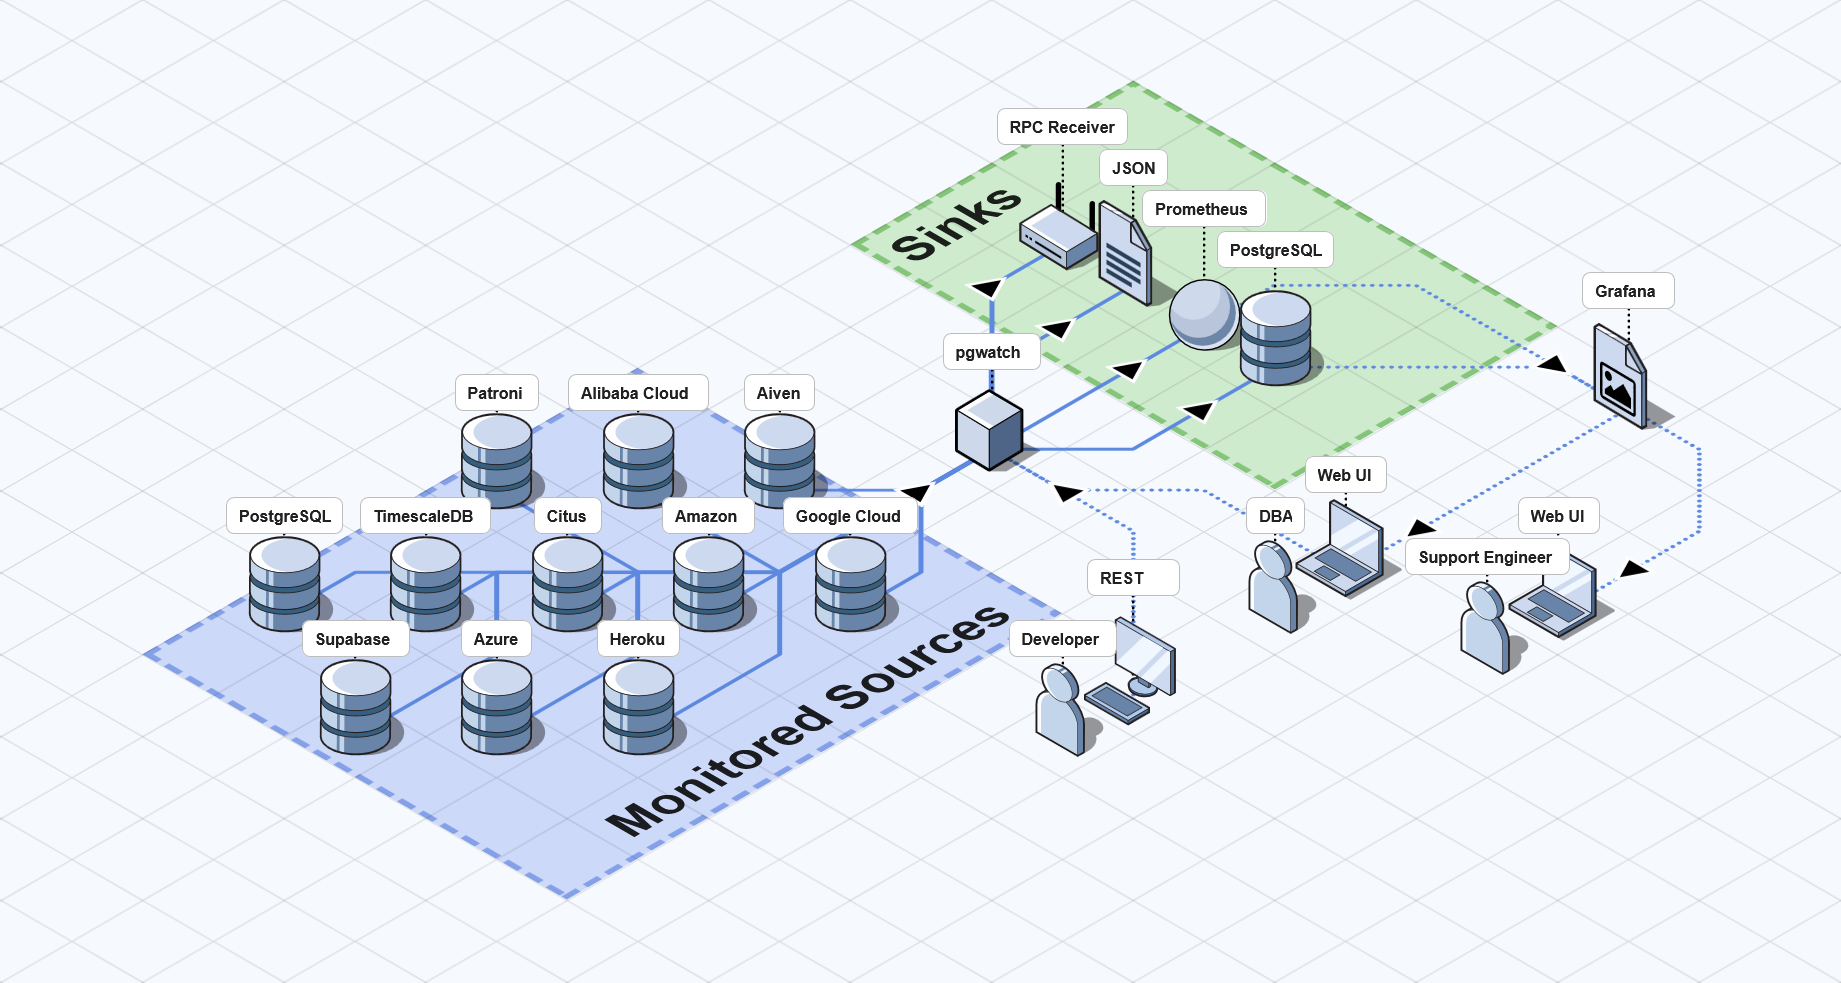
A monitoring service that collects PostgreSQL metrics continuously, stores them in a PostgreSQL database of its own, and shows them through Grafana dashboards that arrive ready-made.
▶Repo detailsthe review · specs · pros & cons · install
What it is
A monitoring service written in Go that collects metrics from one or many PostgreSQL databases, stores them in a PostgreSQL database of its own, and shows them through Grafana dashboards that come with it. There is a demo image that starts everything in one command.What it is good for. Anyone running PostgreSQL in production without a monitoring bill. This completes a chain five editions have been building. Edition 18 gave you pgBadger, which reads yesterday's log and names the slow queries. Edition 20 gave you pev2, which explains why one query is slow. Edition 23 gave you HypoPG, which tests an index before you build it. Edition 24 gave you Dexter, which finds the index for you. All four look at one moment. This one watches all the time, so you see the shape of the week. Grasppy's data lives in PostgreSQL on one server, which is exactly the case this is for.
- BSD-3-Clause, which is permissive with no conditions on commercial use.
- Dashboards arrive ready-made, so you get a useful screen without designing one.
- One command starts a complete demonstration, so you can see what it looks like before you commit.
- It brings Grafana and a second PostgreSQL database with it, so this is three moving parts, not one.
- It stores metrics forever unless you tell it not to, and a busy database produces a lot of them.
- The README's production instructions still tell you to check out
v5.0.0, while the newest tag isv6.0.0of 15 September 2026. Read both before you copy the commands.
 dalibo/pg_activity
Published in Edition 23. It shows you what the database is doing this second in a terminal, and it keeps no history at all.
Track this in Scout- prometheus-community/postgres_exporter
It publishes the same kind of numbers for Prometheus to collect, and it gives you no storage and no dashboards, so it suits you only if you already run Prometheus.
Track this in Scout  darold/pgbadger
Published in Edition 18. It reads the database's own log file and writes one report, which answers what happened rather than what is happening.
Track this in Scout
docker run --detach --name pgwatch-demo \
  -p 5432:5432 -p 3000:3000 -p 8080:8080 -e PW_TESTDB=true \
  cybertecpostgresql/pgwatch-demo