3.5k stars · PostgreSQL Licence · v1.22.0 (2026-06-18), read from the About sidebar on the repository page · Track this in Scout
Draws a PostgreSQL query plan as a tree with timings and row counts, and marks the step that is actually costing you the time.
▶Repo detailsthe review · specs · pros & cons · install
What it is
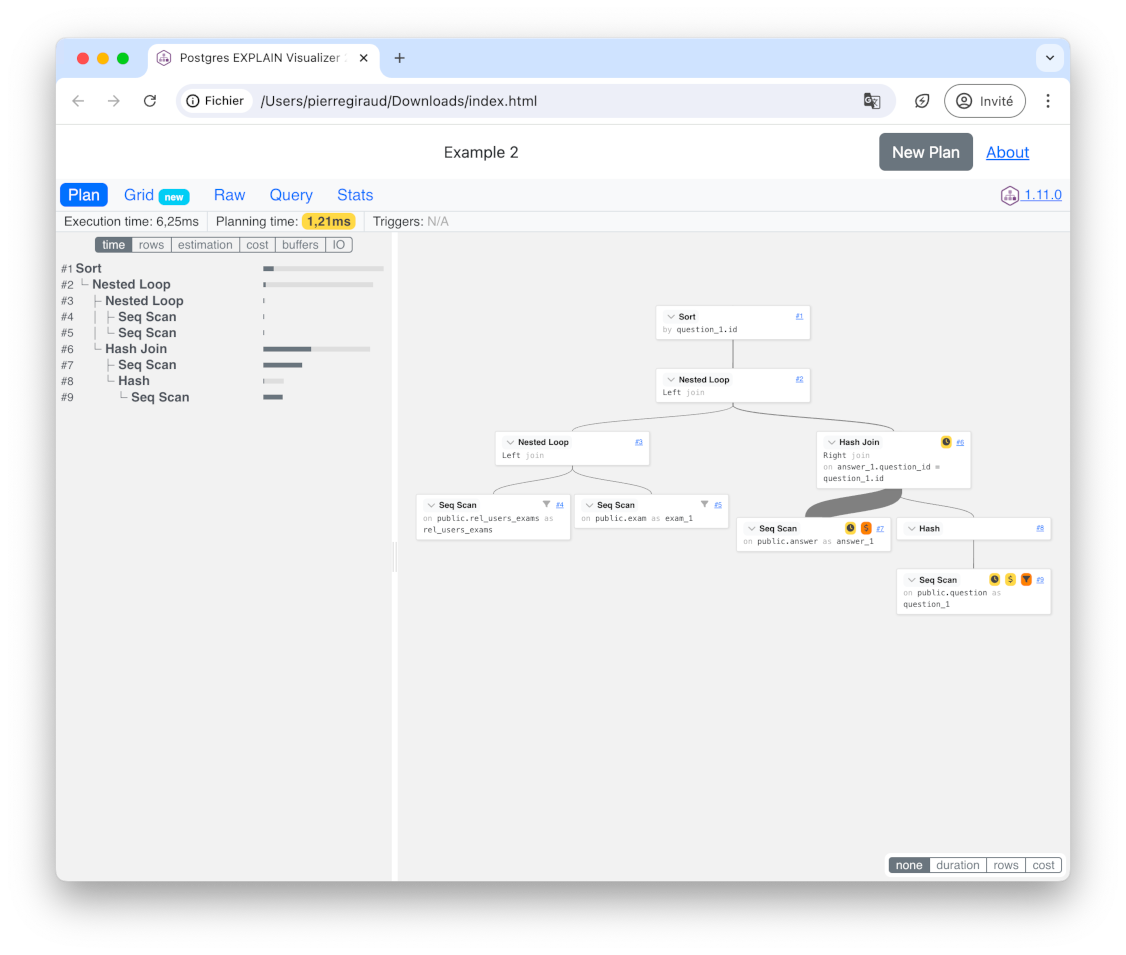
A viewer for PostgreSQL query plans that runs in a browser. You paste the output of EXPLAIN (ANALYZE, BUFFERS, FORMAT JSON) and it draws the plan as a tree with the time, the row counts and the worst step marked.What it is good for. Anyone whose app has one page that is slower than the rest. Edition 18 gave you pgBadger (#6), which reads your database's log file and names your slowest queries in order. That answers which. This answers why, and the two together are the whole job. For Grasppy, whose map screen does real work for every request, this is the first place to look when the map takes four seconds instead of one.
- There is nothing to install. The page at explain.dalibo.com works today, on a phone.
- It marks the steps where the database guessed the number of rows badly, and that guess is usually the real fault.
- You can run your own copy, so a query plan from a private database never has to leave your machine.
- PostgreSQL only.
- Using the hosted page means pasting your query text onto somebody else's website. For anything sensitive, run your own copy instead.
- It explains the problem and does not fix it. You still have to add the index or rewrite the query yourself.
- ankane/pghero
A performance dashboard for the whole database rather than one query, showing slow queries, unused indexes and index suggestions, so it finds problems where pev2 explains one.
Track this in Scout - AlexTatiyants/pev
The original Postgres Explain Visualizer, which pev2 was rewritten from by Dalibo; still available and still simpler, with fewer measurements shown.
Track this in Scout  darold/pgbadger
Solves the other half: it reads PostgreSQL's log file and reports your slowest queries across a whole day, rather than explaining any single one.
Track this in Scout
# Nothing to install for the normal route. First get the plan, in psql:
#
#   EXPLAIN (ANALYZE, BUFFERS, VERBOSE, FORMAT JSON) SELECT ... ;
#
# Copy the whole result, then open https://explain.dalibo.com and paste it.
# For a private plan, take the standalone page from the releases list at
#   https://github.com/dalibo/pev2/releases/latest
# It is a single HTML file. Save it and open it with your browser — no
# server and no internet connection needed.