Overview
Summary
The useful answer before the supporting detail.
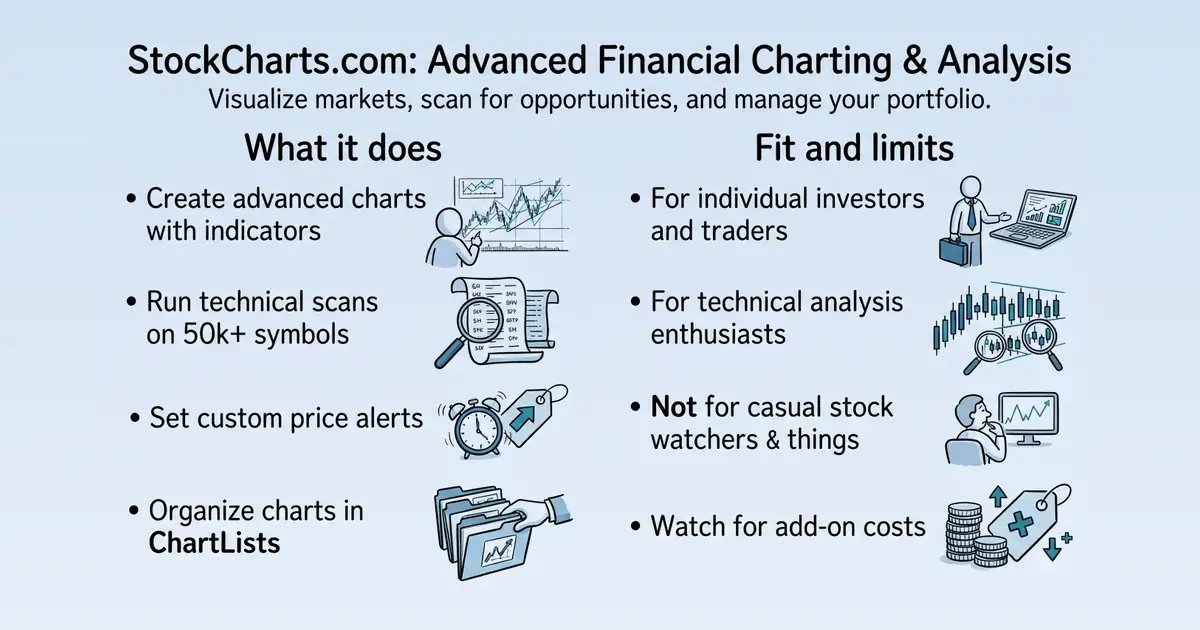
StockCharts.com is a web-based platform for advanced financial charting, screening, and analysis, helping investors visualize market data to make informed decisions S1. It serves individual investors and traders who need tools to analyze stocks, ETFs, cryptocurrencies, and other securities S10 S59. The platform provides charting, technical scans, alerts, and portfolio management resources, with a free trial and tiered subscription plans S59.
Product identity and positioning
Name, category, positioning, audience, and first-party claims.
- Identity: StockCharts.com is a web-based financial charting and analysis platform S1 S59.
- Core purpose: Helps investors visualize financial data to analyze markets, manage portfolios, and make timely investment decisions S1.
- Intended users: Individual investors and traders globally S1 S59.
- Product scope: A comprehensive toolkit including charting, screening, alerts, and portfolio management, not just a single charting app S59.
- Positioning: A trusted leader in financial charting for over 25 years, empowering modern investors S10 S59.
- Claimed distinction: Award-winning charting tools with a focus on clarity and comprehensive education S10.
Use cases and audiences
Who the product serves and the jobs it is designed to handle.
| Audience | Practical use case |
|---|---|
| Individual investors | Visualize financial data to analyze markets and manage portfolios S1. |
| Technical analysts | Use advanced charting tools and indicators to study price action and volume S10. |
| Traders | Set custom price alerts to stay ahead of market moves S10 S59. |
| Investors seeking new opportunities | Use screening tools to find stocks, ETFs, or other securities matching specific criteria S10 S59. |
| Portfolio managers | Track positions and organize charts using ChartLists S10 S59. |
Traffic and search
SEO analysis
Collected Oct 22, 2026stockcharts.com: an estimated 5,620,732 total monthly visits and about 250,670 monthly organic visits across 21,629 ranking keywords. Scout crawled 15 pages and measured a technical health score of 87/100.
Search summary
The useful answer before the supporting detail.
Trusted by millions of investors around the world, StockCharts offers advanced charting, screening and financial analysis tools to help you trade and invest with confidence. From robust charting to custom market screens and automatic real-time alerts, StockCharts delivers a complete analysis and portfolio management toolkit. stockcharts.com: an estimated 5,620,732 total monthly visits and about 250,670 monthly organic visits across 21,629 ranking keywords. Scout crawled 15 pages and measured a technical health score of 87/100.
- Total traffic (modeled): 5,620,732 monthly visits across all channels.
- Organic search traffic (estimated): 250,670 monthly visits from search.
- Strongest sampled ranking: above the green line at position 1.
- Leading page in the collected evidence: https://stockcharts.com/public/1107832.
- Closest measured organic competitor: abovethegreenline.com, appearing 10 times in the sampled first-page SERPs.
- Technical crawl: 15 pages, health score 87/100.
Website intelligence — Collected evidence
Company identity and positioning
| Page type | Evidence | Source |
|---|---|---|
| other | Trusted by millions of investors around the world, StockCharts offers advanced charting, screening and financial analysis tools to help you trade and invest with confidence. From robust charting to custom market screens and automatic real-time alerts, StockCharts delivers a complete analysis and portfolio management toolkit. | https://stockcharts.com/ |
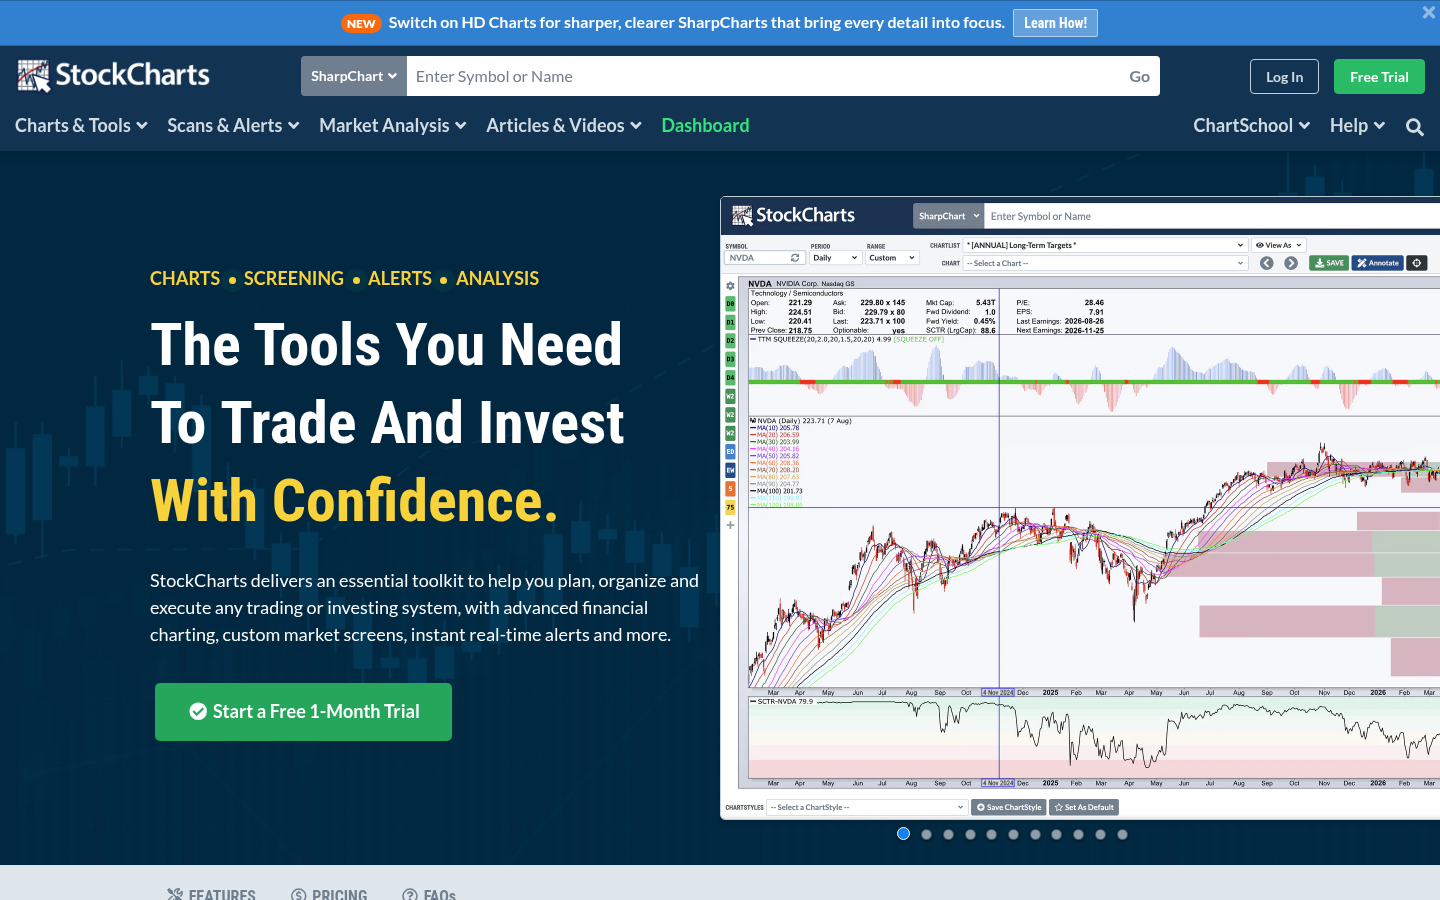
| other | StockCharts delivers an essential toolkit to help you plan, organize and execute any trading or investing system, with advanced financial charting, custom market screens, instant real-time alerts and more. | https://stockcharts.com/ |
| other | Everything you see on StockCharts is designed with one goal in mind: to help you succeed in the markets. | https://stockcharts.com/ |
| other | Our charting and analysis tools, portfolio management resources and comprehensive data coverage deliver a complete package that can be uniquely tailored to fit any approach. That's why millions of investors around the globe have made StockCharts their trusted financial analysis platform for more than two decades. | https://stockcharts.com/ |
| other | From simple candlesticks to advanced technical visualizations, our award-winning charting tools help you see the markets clearly. Compare symbols over multiple timeframes, choose from dozens of powerful indicators, and customize your charts to suit your personal trading or investing style. | https://stockcharts.com/ |
| other | Whether you're looking for stocks making new highs, filtering for strong fundamentals or searching for complex setups that combine multiple technical indicators, our advanced market screening tools give you the power find promising new trade targets or investment opportunities faster than ever before. | https://stockcharts.com/ |
| other | Stay ahead of the markets and on top of your portfolio with custom, real-time alerts for all of the symbols you're following. From simple price alerts to advanced combinations of specific technical and fundamental criteria, our instant alert features will help make sure you never miss a thing. | https://stockcharts.com/ |
| other | But that's just a taste. Our rich feature set provides comprehensive coverage for every step of your investing journey, from trading tools like Scheduled Scans to portfolio management resources like ChartList Reports. | https://stockcharts.com/ |
| other | A trusted leader in financial charting for more than 25 years | https://stockcharts.com/ |
| other | Charting is at the heart of everything we do. Whether you're looking for clean and simple price charts or advanced visualizations that combine multiple technical indicators, our award-winning toolkit has the power and flexibility to meet your unique needs. | https://stockcharts.com/ |
| other | Dozens of proven technical indicators to help you analyze price action and volume, study momentum, spot trends and reversals and discover unique market insights | https://stockcharts.com/ |
| other | Save and organize the charts you're watching in personalized ChartLists for easy access from any device | https://stockcharts.com/ |
Website intelligence — Scout synthesis
- First-party claims: StockCharts positions itself as a trusted leader in financial charting for more than 25 years, serving millions of investors since 1999 W5W14W92. The platform offers advanced charting, screening, real-time alerts, and portfolio management tools W2W11.
- First-party claims: The homepage emphasizes a complete toolkit for trading and investing, with a free 1-month trial W3W6W7.
- First-party claims: Pricing page shows three service levels (Free, Basic, Extra, PRO) with varying features like indicators per chart, ChartLists, Screener, Scans, and Price Alerts W31W33W44W45W46W48.
- First-party claims: Features page highlights charting, screening, dashboards, and market analysis tools W91W93W98W106.
- First-party claims: Marketplace offers add-ons from renowned creators like Larry Williams, MarketGauge, and GoNoGo Charts W77W150W183W204W232.
- Scout inference: The site has strong first-party content for SEO, but the evidence catalog does not include third-party reviews, backlink data, or search performance metrics, limiting competitive and technical analysis.
Domain performance
Modeled total traffic, six-month trend, engagement, countries, and domain identity.
Total website traffic
| Month | Modeled visits |
|---|---|
| 2026-04 | 5,850,730 |
| 2026-05 | 6,006,297 |
| 2026-06 | 6,206,190 |
| 2026-07 | 6,263,452 |
| 2026-08 | 5,947,142 |
| 2026-09 | 5,620,732 |
Top visitor countries
| Country | Name | Traffic share |
|---|---|---|
| US | United States | 77.2% |
| CA | Canada | 11.4% |
| AU | Australia | 1.4% |
| GB | United Kingdom | 1.1% |
| IN | India | 1.0% |
Domain identity
| Signal | Value |
|---|---|
| Registered | Jan 29, 1999 |
| Last changed | May 15, 2026 |
| Expires | Jan 29, 2027 |
| WHOIS server | whois.verisign-grs.com |
| DNSSEC | Not signed |
| Nameservers | NS-1270.AWSDNS-30.ORG, NS-166.AWSDNS-20.COM, NS-1754.AWSDNS-27.CO.UK, NS-905.AWSDNS-49.NET |
Website capture
Organic keywords
Top keywords and an independent Google result page.
Top organic keywords
| Keyword | Volume | CPC | Estimated value |
|---|---|---|---|
| stockcharts | 22,060 | $0.86 | $29,130 |
| stock charts | 13,320 | $0.87 | $10,570 |
| stockcharts com | 1,260 | $0.86 | $2,490 |
| stock chart | 3,700 | $0.63 | $1,460 |
| stockcharts public chart list | 1,190 | $0.29 | $1,440 |
Independent Google result page
Query: above the green line
| Position | Title | URL | Description |
|---|---|---|---|
| 1 | Above the Green Line | https://stockcharts.com/public/1107832 | No information is available for this page. |
| 2 | Above The Green Line: Home | https://abovethegreenline.com/ | The Green Line is our proprietary indicator based on market breadth and momentum. It helps identify the underlying market trend and optimal entry/exit points, |
| 3 | Weekly Stock Pick - What is it? | https://abovethegreenline.com/weekly-stock-pick/ | This TOP PICK of the Week stock strategy provides a simple yet effective approach to short-term trading, focusing on one stock per week and employing clear ... |
| 4 | Above the Green Line (@AboveGreenLine) ... | https://x.com/AboveGreenLine?lang=en | Investment Newsletter using Technical Analysis. Follow the Money, not the Media. Tweets are not investment advice. Above the Green Line |
| 5 | Public ChartLists | https://stockcharts.com/public?sort=followers&asc=true&category=recentlyupdated&showall=true | Below are collections of annotated charts and commentary created by StockCharts.com members who have generously decided to share them publicly. |
| 6 | Above the Green Line | https://www.youtube.com/@AboveTheGreenLine | 3.55K subscribers•1.8K videos #1 Public Site at Stockcharts.com. Live Playlists Videos. How to become a Green Line Member. |
| 7 | Above the Green Line Rules | https://abovethegreenline.com/above-the-green-line-rules/ | Investing with Rules is key to Above the Green line. Only follow the strongest investments based on Relative Strength and Volume. |
| 8 | Who is using "Above The Green Line" chart? : r/investing | https://www.reddit.com/r/investing/comments/1j2dis/who_is_using_above_the_green_line_chart/ | It was recommended to me by a highly experienced trader who said he has been using this method for a long time and its been profitable for him. |
| 9 | Above the Green Line (@AbovetheGreenLine) | https://www.facebook.com/AbovetheGreenLine/ | The Green Line System can help you make more Money in the Stock Market. Only put your money in inves. Buy above $4.95 on High Volume with a 5% Trailing Sell ... |
| 10 | AbovetheGreenLine — Trading Ideas and Scripts | https://www.tradingview.com/u/AbovetheGreenLine/ | Welcome to Above the Green Line, since 2005. The Green Line System can help you make more Money in the Stock Market. Investing with Rules . |
Important pages
Pages earning the most estimated search traffic in the sample.
Website intelligence — Collected evidence
Prioritized website intelligence pages
| Type | Page | Words | Change | URL |
|---|---|---|---|---|
| other | StockCharts \ | static | 2,474 | new |
| pricing | Service Levels, Data Plans and Pricing \ | playwright | 1,700 | new |
| pricing | Price Alert Workbench \ | static | 185 | new |
| pricing | Triple Play Indicators by MarketGauge \ | StockCharts.com | static | 798 |
| features | Features & Benefits \ | playwright | 2,453 | new |
| integrations | Marketplace \ | static | 654 | new |
| integrations | Advanced Indicator Pack \ | StockCharts.com | static | 595 |
| integrations | GoNoGo Charts \ | StockCharts.com | static | 1,453 |
| integrations | Larry Williams Stock Trading Starter Pack \ | StockCharts.com | static | 1,635 |
| integrations | Opening Range by MarketGauge \ | StockCharts.com | static | 1,238 |
| integrations | Real Motion by MarketGauge \ | StockCharts.com | static | 691 |
| integrations | Mary Ellen McGonagle's "The Art of Spotting a Winning Stock" \ | StockCharts.com | static | 694 |
Features
| Page type | Evidence | Source |
|---|---|---|
| features | OVERVIEW [FEATURES](#highlights) PRICING SERVICE LEVELS DATA PLANS [FAQs](#faq) | https://stockcharts.com/features/ |
| features | YOUR COMPLETE TECHNICAL TOOLKIT | https://stockcharts.com/features/ |
| features | A trusted leader in financial charting for more than 25 years, built to empower the modern investor. | https://stockcharts.com/features/ |
| features | Charting is at the heart of everything we do. Whether you're looking for clean and simple price charts or advanced visualizations that combine multiple technical indicators, our award-winning toolkit has the power and flexibility to meet your unique needs. | https://stockcharts.com/features/ |
| features | Dozens of Chart Types | https://stockcharts.com/features/ |
| features | Tons of chart types, from OHLC bars and Candlesticks to Kagi and Renko charts, plus multi-symbol performance charts, Point & Figure, Seasonality and much more | https://stockcharts.com/features/ |
| features | Tons of Indicators | https://stockcharts.com/features/ |
| features | Dozens of proven technical indicators to help you analyze price action and volume, study momentum, spot trends and reversals and discover unique market insights | https://stockcharts.com/features/ |
| features | Create Chart Templates | https://stockcharts.com/features/ |
| features | Save all the settings from your favorite chart configurations as templates we call "ChartStyles" to lock in your best setups and apply them again in the future | https://stockcharts.com/features/ |
| features | Save Your Charts | https://stockcharts.com/features/ |
| features | Save, organize, and easily review the charts you're watching in personalized "ChartLists" for easy access from any device, anywhere, anytime. | https://stockcharts.com/features/ |
| features | SCREENING + SCANNING | https://stockcharts.com/features/ |
| features | Find your next great trade or investment with ease | https://stockcharts.com/features/ |
| features | With an expansive collection of technical and fundamental filters, paired with group selections for major indexes, sectors, industries, and even your own watch lists, our screener and scanning tools let you define the exact specs of your ideal stock, ETF, or other security and pinpoint the matching targets with ease. | https://stockcharts.com/features/ |
| features | Plus, you can schedule your scans to run automatically for you every day, or turn them into automatic alerts that notify you in real-time as soon as your targets trigger. | https://stockcharts.com/features/ |
| features | Extensive technical criteria for price, performance, volume, major indicators and chart patterns | https://stockcharts.com/features/ |
| features | Comprehensive fundamental filters for the financial metrics that matter most | https://stockcharts.com/features/ |
| features | Target indexes, sectors, industries, Your ChartLists and other groups | https://stockcharts.com/features/ |
| features | Built for stocks, ETFs, cryptocurrencies, and other securities alike | https://stockcharts.com/features/ |
Pricing and plans
| Page type | Evidence | Source |
|---|---|---|
| pricing | OVERVIEW FEATURES [PRICING](#service-levels) [SERVICE LEVELS](#service-levels) [DATA PLANS](#data-plans) [FAQs](#faq) | https://stockcharts.com/pricing/ |
| pricing | To help you learn more about subscribing to StockCharts, we've put together this brief yet helpful video. It will tell you everything you need to know about our Service Levels, Data Plans, renewal options and pricing in order to make sure you get set up with the account options that are right for you. | https://stockcharts.com/pricing/ |
| pricing | Not a member yet? Start your FREE 1-month trial! | https://stockcharts.com/pricing/ |
| pricing | Start Your Free Trial | https://stockcharts.com/pricing/ |
| pricing | Service Levels & Pricing | https://stockcharts.com/pricing/ |
| pricing | \ | free \ |
| pricing | \ | \ |
| pricing | For all Service Levels, you can choose to subscribe on either a Monthly or an Annual basis. With our Monthly Renewal option, you pay for one month of service at a time, and your account will simply renew automatically each month. With our Annual Renewal option, you prepay for 12 months of service, and we'll give you the 13th month for free. If at any point you'd like to change your Service Level or renewal preferences, you can always do so from the Your Account page. | https://stockcharts.com/pricing/ |
| pricing | All StockCharts accounts come standard with our free data plan, which uses BATS real-time data for the US, and delayed data for all other markets. However, if you'd like to enhance your StockCharts membership even more, you can customize your account by adding official real-time Data Plans for one or more of the stock exchanges we support. | https://stockcharts.com/pricing/ |
| pricing | \ | Price \ |
| pricing | \ | No Charge \ |
| pricing | \ | $9.95/month \ |
| pricing | \ | $9.95/month \ |
| pricing | \ | $9.95/month \ |
| pricing | All Data Plans are billed separately from your Service Level subscription, and always on a monthly basis. Prices vary as they reflect the fees charged by the exchanges for your use of the real-time data. Data Plans may be added or removed at any time from the Your Account page. Unless removed from your account, Data Plans renew automatically at the end of each billing month. If you do choose to remove a plan, the change will take effect at the end of the billing month. All Data Plan charges are non-refundable. | https://stockcharts.com/pricing/ |
| pricing | Level up your investing process and trading toolkit for free in less than 60 seconds. Create bigger, better, more advanced financial charts. Save and organize your charts. Run lightning-fast screens, create custom scans and set automatic alerts with your own unique market filters. Plus, enjoy a completely clean ad-free experience. | https://stockcharts.com/pricing/ |
| pricing | Free 1-Month Trial | https://stockcharts.com/pricing/ |
| pricing | [How does the free 1-month trial work?](#panel01) | https://stockcharts.com/pricing/ |
| pricing | With our trial, the first month of service is totally free. All new trial accounts begin at our Extra service level, but you may upgrade or downgrade at any point during the free month. After that period, we'll charge your credit card for another month of whichever service level you last selected. You can cancel at any time during the trial month and will not be billed. Please note that subscription charges are non-refundable, including data plans. | https://stockcharts.com/pricing/ |
| pricing | Absolutely! We're happy to have you back. If you've been a StockCharts Member within the past year, we should still have all of your saved charts, lists, screens, scans, alerts and other custom work. Click here to restore your expired StockCharts account! | https://stockcharts.com/pricing/ |
Integrations and supported platforms
| Page type | Evidence | Source |
|---|---|---|
| integrations | StockCharts Marketplace | https://stockcharts.com/marketplace/ |
| integrations | UNLOCK MORE CHARTING POWER | https://stockcharts.com/marketplace/ |
| integrations | [Add-Ons](#all-addon) [Courses](#all-courses) [ChartPacks](#all-chartpacks) | https://stockcharts.com/marketplace/ |
| integrations | ADD-ONs & PLUG-INs | https://stockcharts.com/marketplace/ |
| integrations | Elevate and deepen your analysis on StockCharts with exclusive tools, unique indicators, and advanced features designed to expand your charting and analysis capabilities. Explore the full collection below and click on a card to learn more. | https://stockcharts.com/marketplace/ |
| integrations | [](/marketplace/addons/optionsplay.html) | https://stockcharts.com/marketplace/ |
| integrations | ](/marketplace/addons/optionsplay.html) | https://stockcharts.com/marketplace/ |
| integrations | [](/marketplace/addons/optionsplay.html)See More | https://stockcharts.com/marketplace/ |
| integrations | [](/marketplace/addons/larry-williams.html) | https://stockcharts.com/marketplace/ |
| integrations | ](/marketplace/addons/larry-williams.html) | https://stockcharts.com/marketplace/ |
| integrations | [](/marketplace/addons/larry-williams.html)Learn More | https://stockcharts.com/marketplace/ |
| integrations | [](/marketplace/addons/gonogo-charts.html) | https://stockcharts.com/marketplace/ |
| integrations | ](/marketplace/addons/gonogo-charts.html) | https://stockcharts.com/marketplace/ |
| integrations | [](/marketplace/addons/gonogo-charts.html)Learn More | https://stockcharts.com/marketplace/ |
| integrations | [](/marketplace/addons/trend-investor-pro.html) | https://stockcharts.com/marketplace/ |
| integrations | ](/marketplace/addons/trend-investor-pro.html) | https://stockcharts.com/marketplace/ |
| integrations | [](/marketplace/addons/trend-investor-pro.html)Learn More | https://stockcharts.com/marketplace/ |
| integrations | [](/marketplace/addons/trading-simplified.html) | https://stockcharts.com/marketplace/ |
| integrations | ](/marketplace/addons/trading-simplified.html) | https://stockcharts.com/marketplace/ |
| integrations | [](/marketplace/addons/trading-simplified.html)Learn More | https://stockcharts.com/marketplace/ |
Product and company updates
No supporting public-page evidence was collected for this category.
Website intelligence — Scout synthesis
- First-party claims: Key pages include the homepage (stockcharts.com), pricing page (/pricing/), features page (/features/), and marketplace pages (/marketplace/ and add-on pages) W1W25W90W114.
- First-party claims: The homepage includes anchor links to FEATURES, PRICING, and FAQs W4.
- First-party claims: The pricing page includes sections for Service Levels, Data Plans, and FAQs W25.
- First-party claims: The features page includes sections for highlights, service levels, data plans, and FAQs W90.
- First-party claims: Marketplace page lists add-ons, courses, and ChartPacks W116.
- Scout inference: The evidence catalog does not include a sitemap or crawl data to identify all important pages.
Rank tracking
Persistent keyword baselines and position movement.
This analysis created the first position baseline at 2026-10-22T21:50:24.673Z. Movement appears after the next fresh analysis using the same location and language.
Features
Features and capabilities
Core functions and evidence-backed product capabilities.
| Capability | What it does |
|---|---|
| Advanced Charting | Create interactive, full-screen charts with dozens of technical indicators and multiple chart types (candlestick, bar, line, etc.) S10. |
| Technical Scans | Run pre-built or custom scans on over 50,000 symbols to find stocks meeting specific technical criteria S10. |
| Price Alerts | Set custom alerts for any symbol to receive notifications via email, text, or web S10 S109. |
| ChartLists | Save, organize, and review charts in personalized lists accessible from any device S10. |
| Market Summary Dashboard | Access a professionally curated dashboard with key market data and internals for top-down analysis S10. |
| Historical Data | Review and download complete price history for any symbol, with data back to 1980 for paid plans S10 S59. |
| Add-Ons & Plugins | Enhance analysis with pro-built indicators and exclusive tools from the Marketplace S10 S122. |
Integrations and ecosystem
Connected products, exports, APIs, and workflow compatibility.
| Integration or interface | Type | What it enables |
|---|---|---|
| OptionsPlay | Add-on integration | Provides customized options strategies and educational content within the StockCharts platform S126. |
| GoNoGo Charts | Add-on | Adds trend identification indicators to charts for clearer market analysis S123. |
| MarketGauge Triple Play Indicators | Add-on | Adds volume trend strength indicators to confirm price trends S113. |
| Larry Williams Stock Trading Starter Pack | Add-on | Provides charting tools used by trader Larry Williams S156. |
| Mary Ellen McGonagle's Course | Add-on | Offers educational content on spotting winning stocks S125. |
| Marketplace | Extension framework | Allows users to explore and install exclusive add-ons and plugins S10 S122. |
Pricing
Pricing and plans
Published plans, free access, trials, credits, and pricing limitations.
| Plan or offer | Verified price and billing | Included | Limits |
|---|---|---|---|
| Free | $0 | Limited charts with 3 indicators per chart, 1 scan S101 | 3 indicators per chart, 1 scan S101 |
| Basic | $19.95/month (monthly billing); annual prepay gives 13th month free S101 | 200 scans, 200 screener runs, 25 indicators per chart, 100 price alerts S101 | 25 indicators per chart, 100 price alerts S101 |
| Extra | $29.95/month (monthly billing); annual prepay gives 13th month free S101 | 200 scans, 10 scheduled scans, 25 indicators per chart, 100 price alerts S101 | 25 indicators per chart, 100 price alerts S101 |
| PRO | $49.95/month (monthly billing); annual prepay gives 13th month free S101 | 500 scans, 25 scheduled scans, historical data from 1900, 500 price alerts S101 | 500 price alerts S101 |
| Real-time data plans | $9.95/month per exchange (billed separately, monthly) S101 | Official real-time data for US (NYSE, NASDAQ), Canada (TSX), or UK (LSE) S101 | Per exchange S101 |
Competition
Competitive landscape
Domains competing for the same organic search demand.
Sampled competitors
| Competitor | First-page appearances | Sampled queries | Average position | Queries observed |
|---|---|---|---|---|
| abovethegreenline.com | 10 | 2 | 5 | above the green line, above the green line stockcharts |
| youtube.com | 3 | 2 | 5 | above the green line, above the green line stockcharts |
| reddit.com | 3 | 2 | 5 | above the green line, above the green line stockcharts |
| tradingview.com | 2 | 2 | 5 | above the green line, above the green line stockcharts |
Website intelligence — Collected evidence
Customers, testimonials, and first-party review claims
No supporting public-page evidence was collected for this category.
Independent review sources discovered
No links to supported independent review platforms were discovered on the collected pages.
Website intelligence — Scout synthesis
- First-party claims: StockCharts claims to be a "trusted leader in financial charting for more than 25 years" W14W92.
- First-party claims: The homepage states "millions of investors around the globe have made StockCharts their trusted financial analysis platform" W8.
- First-party claims: The marketplace page mentions partnerships with "renowned indicator creators, technical experts and charting legends" W77W150W183W204W232.
- Scout inference: No competitor names or comparative data are provided in the evidence catalog.
AI visibility
Measured ChatGPT and Google AI mentions with cited sources.
AI-assistant referral traffic
- Estimated current generative-AI referral share: 0.6%
| Month | Traffic share | Source |
|---|---|---|
| — | — | All AI assistants |
| — | — | All AI assistants |
| — | — | All AI assistants |
Website intelligence — Collected evidence
Site-stated AI capabilities
No supporting public-page evidence was collected for this category.
These are first-party product claims, not independent measurements of AI-search visibility.
Website intelligence — Scout synthesis
- First-party claims: The homepage and features pages contain structured content that could be used by AI models, such as clear headings and feature lists W1W2W91W93.
- First-party claims: The pricing page includes a comparison table that is machine-readable W31W33W34W35W36W37W38W39W40W41W42W43W44W45W46W47W48.
- Scout inference: No AI visibility metrics (e.g., ChatGPT mentions, AI search appearances) are present in the evidence catalog.
Marketing opportunities
Actions calculated directly from the collected evidence.
| Opportunity | Recommended action | Evidence |
|---|---|---|
| Competitor gap | Review the sampled queries where abovethegreenline.com appears. | 10 first-page appearances across above the green line, above the green line stockcharts |
Website intelligence — Collected evidence
Website evidence gaps
- customers: no usable public page was collected; verify whether the site publishes this evidence.
- reviews: no usable public page was collected; verify whether the site publishes this evidence.
- changes: no usable public page was collected; verify whether the site publishes this evidence.
- identity: no usable public page was collected; verify whether the site publishes this evidence.
- technical: no usable public page was collected; verify whether the site publishes this evidence.
Website intelligence — Scout synthesis
- First-party claims: The homepage promotes a free 1-month trial, which is a strong conversion opportunity W3W20W28W29W84W85W159W160.
- First-party claims: The pricing page highlights three service levels, allowing for upselling from free to paid tiers W30W31.
- First-party claims: The marketplace offers add-ons for purchase, creating additional revenue streams W78W80W88W89.
- First-party claims: The features page emphasizes a "complete technical toolkit" and includes calls-to-action like "Sign Up Now" W91W105.
- First-party claims: The price alert workbench page encourages upgrades for more alerts W54W55.
- Scout inference: The evidence catalog does not include marketing analytics or conversion data.
Trust and proof
Customers, proof, and reviews
Published proof, customer signals, and review evidence.
Independent reviews
| Platform | Page | How it was found | Note |
|---|---|---|---|
| Trustpilot | StockCharts.com Reviews / Read Customer Service Reviews of www.stockcharts.com | Grounded web search | ## Add more advanced features The charting itself is good and fast, and it’s fine for basic technical analysis. I expected more honestly. The platform is stuck in 2015. Not terrible, not great - 3 stars. Could be more if you add more advanced features. |
| Bullish Bears | StockCharts Review 2026: Pricing, Pros, Cons & Alternatives | Grounded web search | Our StockCharts review found that while the platform has solid scanning tools and valuable education through ChartSchool, its delayed data and static charts make it better suited for swing traders than active day traders. ... StockCharts.com has approximately 16 customer reviews on Trustpilot with a 2.5 TrustScore (Poor as of March 2026). ... There’s no doubt about it; StockCharts has merit, but it all depends on what type of trader you are. It would be much better for swing traders and investor |
| Liberated Stock Trader | StockCharts Review & Lab Test 2026. Is it Worth Your Money? | Grounded web search | The key takeaway: StockCharts is strongest when you want serious, technician-first charting, custom scans, and a high-signal community, but it trails modern platforms in AI, ... StockCharts.com is a specialist technical analysis platform that shines when your edge comes from repeatable chart-and-scan workflows. It’s not a modern “everything app,” and our scores reflect that: excellent scanning and community, good chart depth, fair pricing—offset by weak news, limited ecosystem connectivity, no |
| TradingToolsHub | StockCharts Review 2026 / TradingToolsHub | Grounded web search | plans: Free: Free / Basic: $19.95/mo / Extra: $29.95/mo / Pro: $49.95/mo. - • Feature fit checked against 3 supported capability flags, including Price Alerts, Mobile App, Education Content. - ... . It is weaker if you need AI Analysis, Backtesting, |
| tradersunion.com | StockCharts.com Review – Is it Safe and Legit? (September 2026) | Grounded web search | , users have left 115 reviews about the company. The most recent review was posted on 20 September 2026, and the overall Trustpilot rating for StockCharts.com is 4.3. / 4.3 /5 rate of 115 reviews / / / --- / --- / / 5-star / 63.48% / / 4-star / 11.3% / / 3-star / 8.7% / / 2-star / 3.48% / / 1-star / 13.04% / |
| brokersdb.com | StockCharts Review 2026: The Trusted Standard for Classical Technical Analysis / BrokersDB | Grounded web search | charting on the web / No order execution — analysis only / / Publication-quality SharpCharts images / Interface feels dated compared to TradingView ... market data / / Excellent educational content and commentary / No custom indicator development / / |
| luxalgo.com | StockCharts.com: Visual Analysis Review / LuxAlgo Blog | Grounded web search | The better fit depends on what you want to accomplish. StockCharts provides established charting and screening workbenches; LuxAlgo connects its charts, indicator Library, and strategy tools. Both require you to interpret the evidence and define risk. This |
| aistockpickerapps.com | StockCharts.com Review 2026 / Pricing & Is It Worth It | Grounded web search | ### Is StockCharts.com legit? StockCharts.com is an established, working product rated 4.5 out of 5 on Trustpilot (113 reviews). We list it because it has a real AI feature, not because it paid us. The biggest drawback we found: Real-time data costs $9.95 |
Customer proof
No named customers, testimonials, or customer case studies were found.
Independent mentions
- stockcharts.com Reviews — #### Mainly negative reviews ... Total reviews: 30 Average score: 2.7 stars Learn more ... The total score is based on reviews found on the following sites ... - Sitejabber: 3.4/5 stars, 9 reviews - MyWOT: 4.6/5 stars, 5 reviews - Trustpilot: 2/5 stars, 11 reviews - Scamadviser: 1/5 stars, 5 reviews
- StockCharts.com / TrendSpider Learning Center — StockCharts.com offers various subscription tiers to cater to different user needs and budgets. The Basic membership is priced at $14.95 per month, offering core charting tools ... features is also available for users looking to test out the platform.
External links were grounded in one live web search. Search snippets are leads, not independently scraped page content; rejected links remain available in Review evidence.
Company, security, and trust
Ownership, policies, security signals, and public trust evidence.
| Signal | Finding | Source |
|---|---|---|
| Company and ownership | Chip is the founder and president of StockCharts.com. He founded the company after working as a Windows developer and corporate consultant at Microsoft from 1987 to 1997. Since 1999, Chip has guided the growth and develo | source |
| Contact and support | Visit our Support Center or contact us for answers and assistance | source |
| Legal and privacy | With affordable and transparent pricing, flexible renewal options and multiple service levels to choose from, it's easy to find the account that's just right for you. Plus, our hassle-free account management makes it sim | source |
| Security and compliance | Not published on the collected pages. | — |
| Uptime and status page | Not published on the collected pages. | — |
| Domain registered | 1999-01-29 | — |
| Domain expires | 2027-01-29 | — |
Not found on the collected pages: security and compliance, uptime and status page. This only means Scout did not find it on the pages it read; it says nothing about the company itself.
Documentation and product updates
Help resources, product guidance, and visible changes over time.
| Resource or update | Type | What is available | Date or freshness |
|---|---|---|---|
| Product FAQ | FAQ | Answers common product, workflow, pricing, privacy, ownership, API, and team questions. (source) | Not dated |
| Larry Williams Stock Trading Starter Pack / Add-Ons / StockCharts.com | Product update | Product update is publicly available. (source) | Not dated |
| OptionsPlay / Marketplace / StockCharts.com | Changelog | Public product change history. (source) | Not dated |
Not found in the collected public sources: public roadmap, status page, separate help center or knowledge base.
Technical
Technical and delivery signals
Delivery model, platforms, API, data ownership, reliability claims and release activity.
| Signal | Finding | Source |
|---|---|---|
| Delivery model (cloud, self-hosted, desktop, browser extension) | Web-based platform, no installation required S10. | S10 |
| Platforms and apps | Accessible via web browser on any device S10. | S10 |
| API and extensibility (API, SDK, webhooks, MCP, plugins) | Offers add-ons and plugins via the Marketplace S122. | S122 |
| Data ownership and export | Users can download complete price data history S10. | S10 |
| Performance and reliability claims | Provides real-time charts that update automatically S10. | S10 |
| Release activity | Not published on the collected pages. | — |
Measured infrastructure
Domain, certificate, and hosting signals, measured directly.
| Signal | Finding |
|---|---|
| Domain registered | 1999-01-29 — Amazon Registrar, Inc. |
| Domain expires | 2027-01-29 |
| First archived | 1999-11-16 — web archive |
| TLS certificate | Amazon, valid, expires 2027-03-13 |
| Security headers | CSP, X-Content-Type-Options, X-Frame-Options |
| Headers not served | HSTS, Referrer-Policy |
| Server header | nginx |
| Mail handled by | d154695a.ess.barracudanetworks.com, d154695b.ess.barracudanetworks.com |
| Nameservers | ns-166.awsdns-20.com, ns-1754.awsdns-27.co.uk |
Technical site audit
A bounded multi-page crawl with page-level issues and URLs.
Scout — Bounded technical crawl
- Pages crawled: 15 of 15 maximum
- Technical health: 87/100
- Critical issues: 0
- Warnings: 36
- Notices: 6
Issues
| Severity | Issue | Value | Affected URL |
|---|---|---|---|
| warning | Title length should be reviewed | 69 | https://stockcharts.com/ |
| notice | Meta description length should be reviewed | 326 | https://stockcharts.com/ |
| warning | Missing canonical URL | — | https://stockcharts.com/ |
| warning | Missing canonical URL | — | https://stockcharts.com/login/index.php |
| warning | Missing canonical URL | — | https://stockcharts.com/checkout/freetrial/ |
| warning | Missing canonical URL | — | https://stockcharts.com/login/index.php |
| notice | Meta description length should be reviewed | 230 | https://stockcharts.com/marketplace/ |
| warning | Missing canonical URL | — | https://stockcharts.com/marketplace/ |
| warning | Missing canonical URL | — | https://stockcharts.com/h-mem/notifications.html |
| warning | Page should have one primary H1 | 0 | https://stockcharts.com/panels/ |
| warning | Missing canonical URL | — | https://stockcharts.com/panels/ |
| warning | Page should have one primary H1 | 0 | https://stockcharts.com/panels/ |
| warning | Missing canonical URL | — | https://stockcharts.com/panels/ |
| notice | Meta description length should be reviewed | 200 | https://stockcharts.com/screener/ |
| warning | Page should have one primary H1 | 2 | https://stockcharts.com/screener/ |
| warning | Missing canonical URL | — | https://stockcharts.com/screener/ |
| notice | Images are missing alt text | 1 | https://stockcharts.com/screener/ |
| warning | Page should have one primary H1 | 0 | https://stockcharts.com/h-mem/your-scans.html |
| warning | Missing canonical URL | — | https://stockcharts.com/h-mem/your-scans.html |
| warning | Page should have one primary H1 | 0 | https://stockcharts.com/h-mem/useralertsummary.html |
| warning | Missing canonical URL | — | https://stockcharts.com/h-mem/useralertsummary.html |
| notice | Images are missing alt text | 1 | https://stockcharts.com/h-mem/useralertsummary.html |
| warning | Missing canonical URL | — | https://stockcharts.com/support/chat.html |
| warning | Page should have one primary H1 | 0 | https://stockcharts.com/support/techsupport.html |
| warning | Missing canonical URL | — | https://stockcharts.com/support/techsupport.html |
| warning | Title length should be reviewed | 69 | https://stockcharts.com/ |
| notice | Meta description length should be reviewed | 326 | https://stockcharts.com/ |
| warning | Missing canonical URL | — | https://stockcharts.com/ |
| warning | Page should have one primary H1 | 0 | https://stockcharts.com/freecharts/ |
| warning | Missing canonical URL | — | https://stockcharts.com/freecharts/ |
| warning | Duplicate title in audit sample | 2 | https://stockcharts.com/ |
| warning | Duplicate title in audit sample | 2 | https://stockcharts.com/ |
| warning | Duplicate title in audit sample | 2 | https://stockcharts.com/login/index.php |
| warning | Duplicate title in audit sample | 2 | https://stockcharts.com/login/index.php |
| warning | Duplicate title in audit sample | 2 | https://stockcharts.com/panels/ |
| warning | Duplicate title in audit sample | 2 | https://stockcharts.com/panels/ |
| warning | Duplicate meta description in audit sample | 2 | https://stockcharts.com/ |
| warning | Duplicate meta description in audit sample | 2 | https://stockcharts.com/ |
| warning | Duplicate meta description in audit sample | 2 | https://stockcharts.com/login/index.php |
| warning | Duplicate meta description in audit sample | 2 | https://stockcharts.com/login/index.php |
| warning | Duplicate meta description in audit sample | 2 | https://stockcharts.com/panels/ |
| warning | Duplicate meta description in audit sample | 2 | https://stockcharts.com/panels/ |
Crawled pages
| Status | Title | H1s | Words | Response | URL |
|---|---|---|---|---|---|
| 200 | StockCharts \ | Advanced Charting, Screening & Financial Analysis Tools | 1 | 2529 | 488 ms |
| 200 | Log In \ | StockCharts.com | 1 | 278 | 153 ms |
| 200 | StockCharts.com \ | Start Your Free Trial: Step 1 of 2 | 1 | 349 | 84 ms |
| 200 | Log In \ | StockCharts.com | 1 | 278 | 130 ms |
| 200 | Marketplace \ | StockCharts.com | 1 | 365 | 235 ms |
| 200 | Notifications \ | StockCharts.com | 1 | 255 | 443 ms |
| 200 | Your Dashboard \ | StockCharts.com | 0 | 190 | 297 ms |
| 200 | Your Dashboard \ | StockCharts.com | 0 | 190 | 84 ms |
| 200 | Screener \ | StockCharts.com | 2 | 7640 | 95 ms |
| 200 | Your Scans \ | StockCharts.com | 0 | 300 | 367 ms |
| 200 | Your Alerts \ | StockCharts.com | 0 | 326 | 86 ms |
| 200 | Chat Assistant \ | Support \ | StockCharts.com | 1 | 228 |
| 200 | Share Your Feedback \ | Support \ | StockCharts.com | 0 | 459 |
| 200 | StockCharts \ | Advanced Charting, Screening & Financial Analysis Tools | 1 | 2529 | 358 ms |
| 200 | Financial Charts & Analysis Tools \ | StockCharts.com | 0 | 1237 | 160 ms |
This is a bounded Scout crawl. Core Web Vitals and Lighthouse scores are not claimed unless a dedicated performance audit is connected.
Search Console and Analytics
First-party search and behavioral data connection state.
Modeled acquisition channels
| Channel | Estimated share |
|---|---|
| direct | 80.7% |
| search | 7.2% |
| search organic | 6.8% |
| search paid | 0.4% |
| social | 5.0% |
| social organic | 4.9% |
| social paid | 0.1% |
| referrals | 2.0% |
| paid referrals | 0.9% |
| 3.6% | |
| gen ai | 0.6% |
| affiliate | 0.0% |
| other | 0.0% |
First-party connections
| Integration | Status | Data available after connection |
|---|---|---|
| Google Search Console | Not connected | Clicks, impressions, CTR, average position, queries, pages, countries, and devices |
| Google Analytics | Not connected | Organic sessions, engagement, landing pages, conversions, geography, and devices |
No first-party Search Console or Analytics numbers are shown until the site owner authorizes the corresponding Google account. Scout traffic model values above are modeled estimates, not private analytics totals.
Limits and method
Limitations and open questions
Known constraints and missing evidence from the collected pages.
The collected pages do not mention any competitors by name. Evidence gaps include lack of detailed security and compliance information, uptime statistics, and independent review ratings. Open questions remain about the full scope of the free tier and any limitations on data export.
Sources, method, and limitations
Evidence inventory, collection method, provider use, and constraints.
This report is based on 14 of 15 collected pages from stockcharts.com, including the homepage, About, Features, Pricing, and Marketplace pages. Data was gathered via static and rendered HTML collection. External proof search was used to verify the existence of review profiles but not their content. Pricing and feature details were cross-referenced with the authoritative pricing page.
- Official Websitehttps://stockcharts.com/Verified
- Official Websitehttps://stockcharts.com/about/Verified
- Official Websitehttps://stockcharts.com/features/Verified
- Pricing Pagehttps://stockcharts.com/pricing/Verified
- Pricing Pagehttps://stockcharts.com/h-mem/price-alert-workbench.htmlVerified
- Pricing Pagehttps://stockcharts.com/marketplace/addons/marketgauge-price-performance.htmlVerified
- Documentationhttps://stockcharts.com/marketplace/Verified
- Documentationhttps://stockcharts.com/marketplace/addons/gonogo-charts.htmlVerified
- Documentationhttps://stockcharts.com/marketplace/addons/larry-williams.htmlVerified
- Documentationhttps://stockcharts.com/marketplace/addons/mem-winning-stock.htmlVerified
- Documentationhttps://stockcharts.com/marketplace/addons/optionsplay.htmlVerified
- Documentationhttps://stockcharts.com/marketplace/addons/simpler-trading-moxie.htmlVerified
- Documentationhttps://stockcharts.com/marketplace/addons/trading-simplified.htmlVerified
- Documentationhttps://stockcharts.com/marketplace/addons/trend-investor-pro.htmlVerified
- Review Sitehttps://www.trustpilot.com/review/www.stockcharts.comVerified
- Review Sitehttps://bullishbears.com/stockcharts-review/Verified
- Review Sitehttps://www.liberatedstocktrader.com/stockcharts-lab-test-review/Verified
- Review Sitehttps://tradingtoolshub.com/review/stockcharts/Verified
- Review Sitehttps://tradersunion.com/reviews/www-stockcharts-com/Verified
- Articlehttps://www.scamadviser.com/check-website/stockcharts.comVerified
- Review Sitehttps://brokersdb.com/learn/stockcharts-reviewVerified
- Review Sitehttps://www.luxalgo.com/blog/stockchartscom-visual-analysis-review/Verified
- Review Sitehttps://aistockpickerapps.com/tool/stockcharts-comVerified
- Articlehttps://trendspider.com/learning-center/stockcharts-com/Verified