2.6k stars · MIT · v1.2.1 (2026-09-07) · Track this in Rising ↗
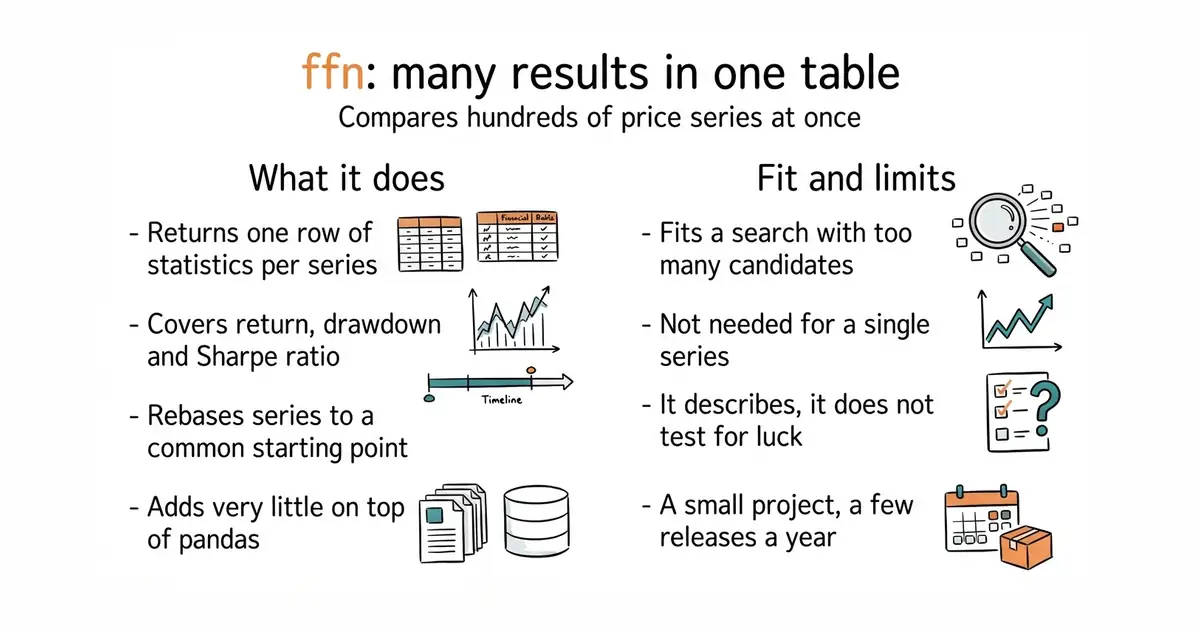
GroupStats: hand it a DataFrame of many equity curves and get one table of performance statistics for all of them.
Radar check
What we found when we opened it. Every bar is one fact, with its date.
Last code pushed 24 Oct 2026, 3 days before this check.
Latest release v1.4.1 on 10 Oct 2026.
Public since June 2014, a little over 12 years.
2,688 stars and 384 forks.
330 commits and 3 new issues in the last 90 days.
58 contributors. 133 pull requests merged in 90 days.
No security policy file says how to report a problem. No published security advisories.
How the bars are scored
- Alive. Days since the last code push: a week or less 100, a month 90, three months 70, six months 50, a year 30, eighteen months 15, older 0.
- Releases. Age of the latest GitHub release, on a similar scale; no bar when the project publishes no releases.
- Maturity. Age of the project: eight years 100, five 90, three 70, two 55, one 40, six months 25, younger 10.
- Adoption. Stars on a log scale: 100,000 stars is 100, 10,000 is 80, 1,000 is 60, 100 is 40.
- Activity. Commits in the last 90 days: 300 or more 100, 100 85, 30 65, 10 45, any 25.
- Community. People who have contributed: 100 or more 100, 30 80, 10 60, 5 40, 2 25, one 10.
- Security. A published security policy 80, none 40; published advisories are listed, not scored.
Checked by Repo Radar on 27 Oct 2026 from the repository on GitHub. Covered in Edition 13.
▶Repo detailsthe review · specs · pros & cons · install
What it does
It is a small library of performance and risk statistics for price series. Its useful part is called GroupStats: hand it a table where each column is one result series and it returns the same statistics for all of them side by side. It calculates total and yearly return, volatility, drawdown, Sharpe and Sortino ratios, win rates and monthly tables. It can also fetch prices, rebase series to a common start and draw simple charts. It builds on pandas and adds very little else. Version 1.4.1 was released on 10 October 2026. It only describes what happened: it does not run a backtest, and it has no opinion about whether a good-looking result is real.
Why it matters
Who it suits. It suits anyone doing a search rather than an analysis, where a parameter sweep has produced far too many candidates to look at one by one. It also suits reporting on several portfolios at once. Skip it if there is only ever one series to look at, where a single-strategy report tool is more useful.
Verdict. Worth an hour, and it changes what is worth testing, because comparing a hundred results stops being a chore. Treat its output as a shortlist and nothing more: it will happily rank a hundred overfitted results, and a statistical test is what says whether the winner was luck. The project is small, with a few releases a year, which is normal for this kind of library and worth knowing. ranaroussi/quantstats is the choice for a deep report on one series; pmorissette/bt, by the same author, runs the test that produces the series.
Summary (Key Points)from the README
Key features
- Performance measurement: Provides utilities for measuring and evaluating financial performance.
- Graphing: Includes graphing helpers for visualising results, with example output shown in the README.
- Data transformations: Offers common transformations for financial time series.
- Built on scientific Python: Builds on Pandas, Numpy and Scipy rather than replacing them.
- Pluggable data providers: Accepts other data sources as callables or installable plugins.
- Yahoo data examples: The Yahoo examples work once an optional provider dependency is installed.
- Documentation set: Covers an introduction, installation guide, quickstart, data providers, provider contract and full API reference.
- Development guide: Explains setup, tests, documentation builds and Copier template updates.
Ways to install
| Platform or method | What it needs | Effort |
|---|---|---|
| pip from the Python Package Index | A working Python environment with pip | Lowest; the README calls this the easiest way |
| Anaconda Scientific Python Distribution, then pip | Anaconda installed first, which includes pip and many required packages | Higher; an extra install before the pip command |
Important
- Not a backtester: The README points users to bt for full backtesting; ffn supplies the underlying functions.
- Optional Yahoo dependency: The Yahoo examples need an extra provider package beyond the base install.
- Many dependencies: The README strongly recommends Anaconda because ffn depends on many packages.
- Provider setup: Non-Yahoo data sources must follow the provider contract or be installed as plugins.
- Docs link missing: The "Read the docs at" line in the README has no URL, so the documentation location must be found elsewhere.
Written by an AI model from the project’s README; not part of the review, and it can be wrong.
- MIT licence, so it can sit behind a commercial feature.
- One call compares any number of series, which lowers the cost of testing more of them.
- Almost no dependencies beyond pandas, so nothing new to maintain.
- It overlaps with single-strategy report tools; the difference is many against one.
- The statistics only describe. They do not test whether a result is more than chance.
- A small project with a few releases a year and a small maintainer team.
python3 -m venv venv
source venv/bin/activate
pip install ffn