11.2k stars · Apache-2.0 · v5.3.1 (2026-09-04)
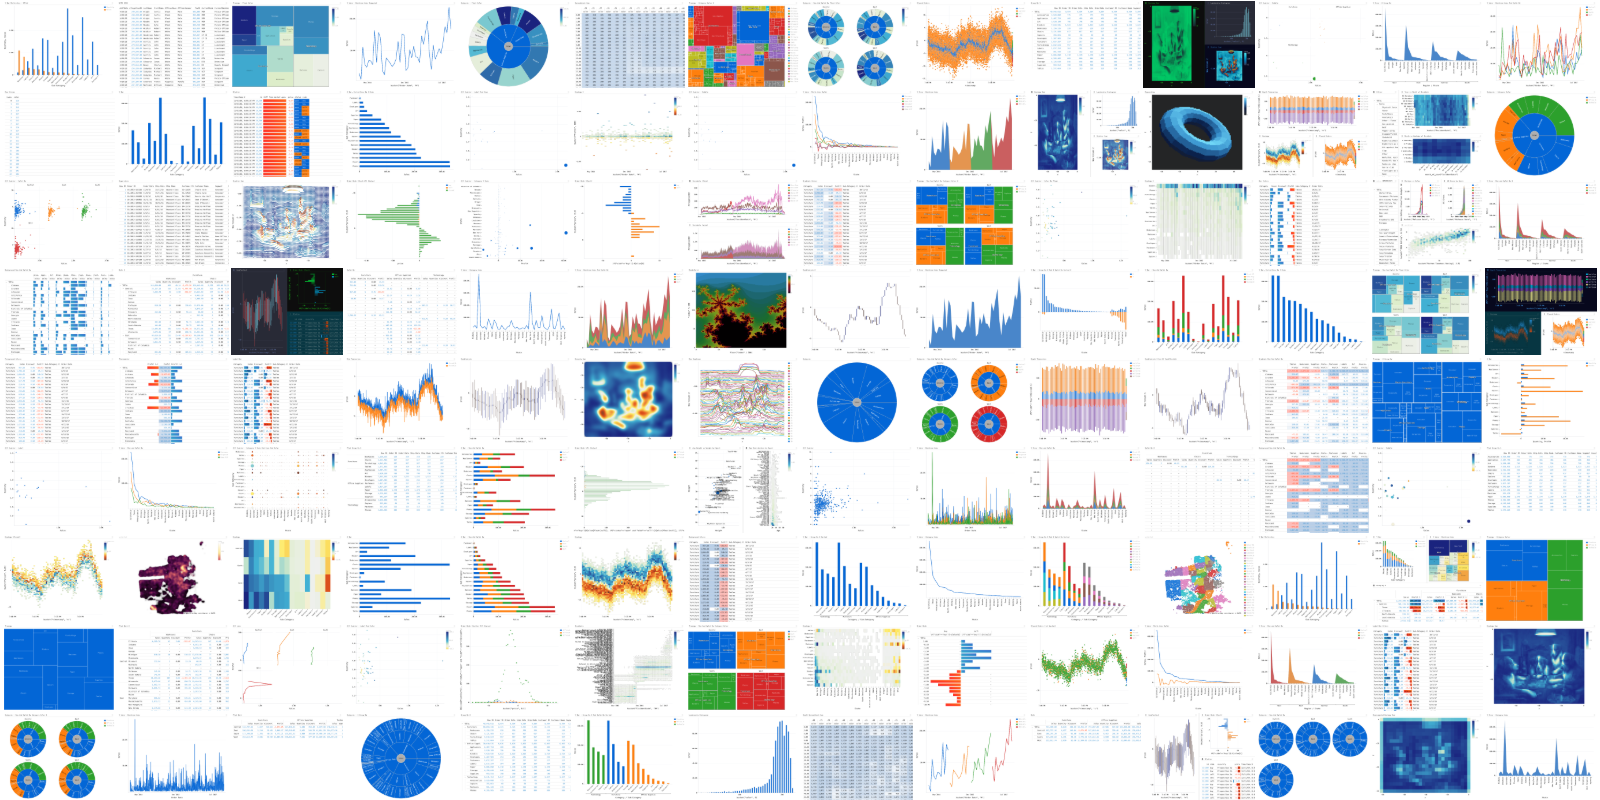
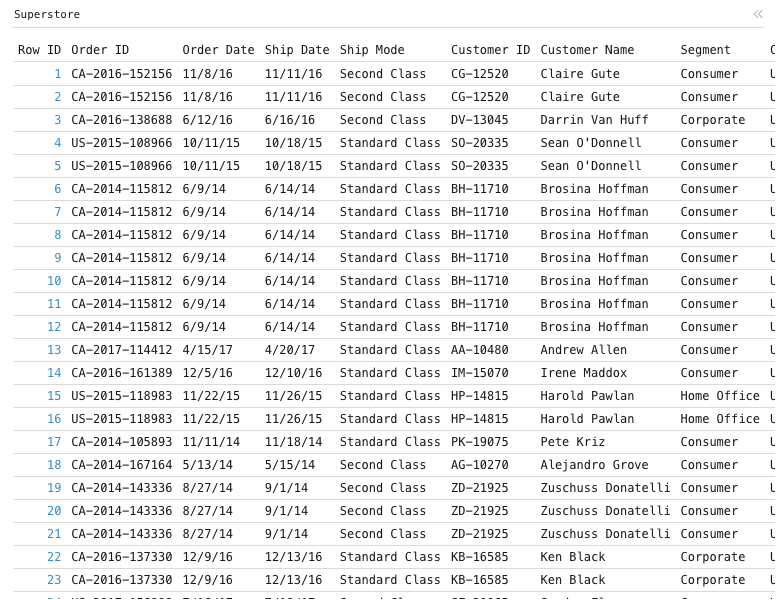
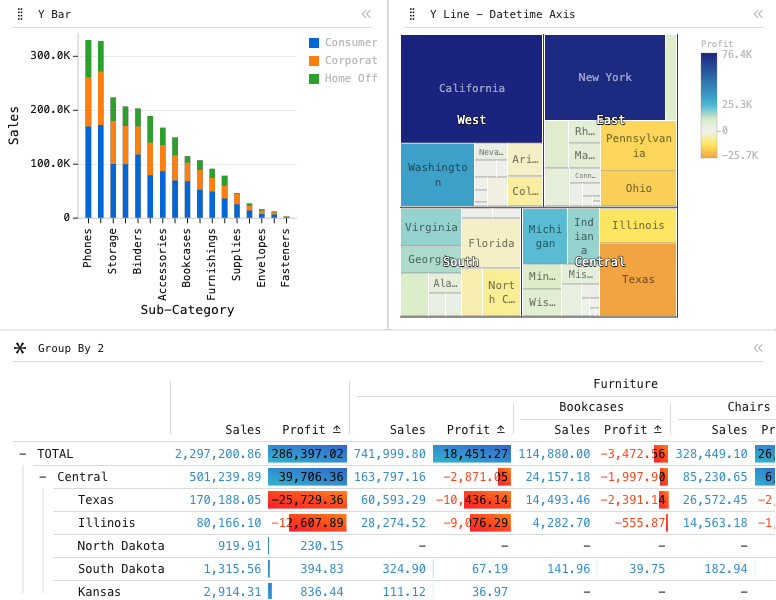
WebAssembly data grid and charts for large or streaming datasets — pivot two hundred thousand trades in the browser.
▶Repo detailsthe review · specs · pros & cons · install
What it is
A data-visualisation and analytics component built for large and streaming datasets, compiled to WebAssembly, with a matching Python package. The same table and chart configuration works in a notebook and in a React page.
Why it matters
ScalpingMate now has a research chain — tsfresh, Optuna, arch, SHAP, skforecast — and, since last week, a chart to show a customer in lightweight-charts (Ed. 11 #10). What it has never had is the screen in between: the one where you interrogate a backtest, pivoting a hundred thousand fills by hour, session and day of week to find out whether the edge is real or lives entirely in one London morning. Perspective does that at a speed a pandas round-trip through FastAPI cannot approach, and Apache-2.0 means the same grid can later sit inside a paid screen. Note the move: finos/perspective now resolves to perspective-dev/perspective.
- Genuinely fast on hundreds of thousands of rows, in the browser, with no server round-trip per pivot.
- One configuration works in a marimo notebook (Ed. 6 #12) and in the React app.
- Apache-2.0, so unlike backtesting.py it is safe inside a paid feature.
- The WebAssembly bundle is large — lazy-load it on an analysis page, never on the landing page.
- Its configuration model is a world of its own to learn, and the docs assume finance-desk familiarity.
- It is for interrogation, not presentation: the polished customer-facing chart is still lightweight-charts.
Python side feeds it from the same DataFrames DuckDB (Ed.
Python side feeds it from the same DataFrames DuckDB (Ed. 10 #11) produces; browser side is a web component dropped into a React analysis route.