In simple English
This tool collects data from your running software so you can see why it broke. It gathers error logs, server speed numbers and trace paths in a single dashboard. You run it on your own server to keep your application data private. It uses open standards so you can send data from many different programming languages. The code is free to run, but you need to manage your own database storage.
What it is
Uptrace is an open-source application performance monitoring system built on OpenTelemetry (a standard way to collect app telemetry data like logs and traces) and ClickHouse (a fast column-oriented database for big data). It gives you a web interface to search logs, view dashboards and set up alerts.
What it is good for
Solo builders who want to track errors and server performance across multiple services without paying for expensive hosted monitoring tools.
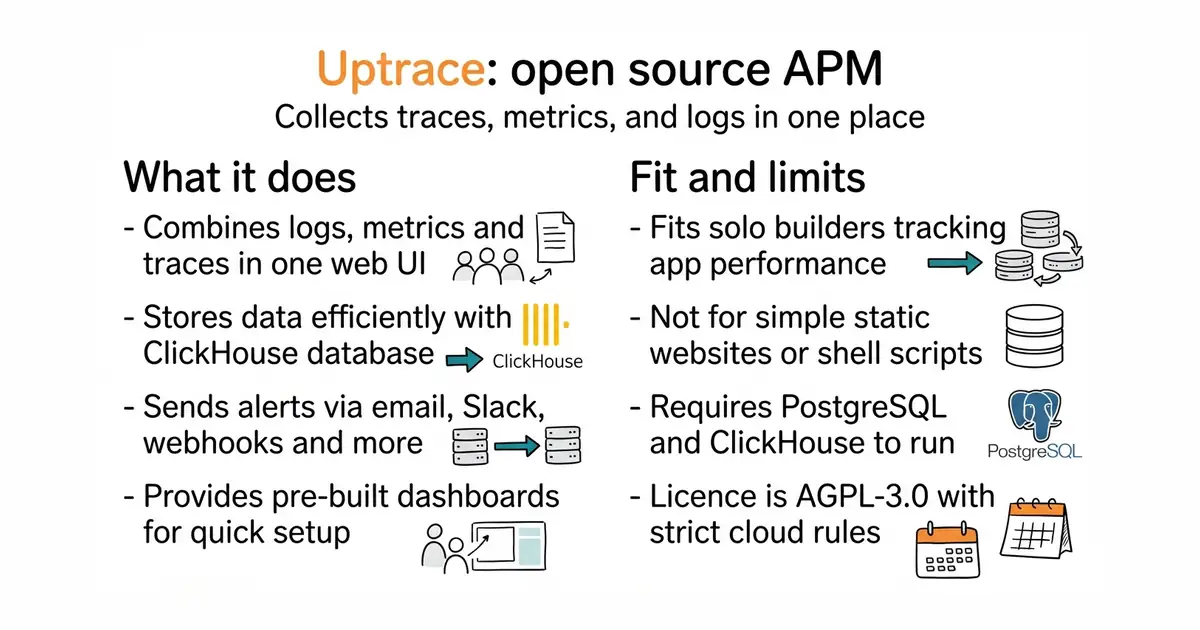
- Combines logs, metrics and traces in one web dashboard.
- Includes over fifty pre-built dashboards that set themselves up.
- Runs efficiently on a single server with high data compression.
- Requires running PostgreSQL (a relational database) and ClickHouse databases alongside the main app.
- Uses the AGPL-3.0 licence which places strict rules on cloud hosting services.
- Setup requires configuring Docker (a way to run a program inside its own sealed box, so it cannot break anything else on your server) and multiple environment variables.
Datadog
Prometheus
- SigNoz/signoz32k stars
Another open-source application performance monitor using ClickHouse and OpenTelemetry.
- elastic/kibana21k stars
Part of the Elastic Stack for searching and viewing application logs and metrics.


- slok/sloth2.6k stars
Generates Prometheus alerting and recording rules from a short specification of a service level objective.
- nicolargo/glances34k stars
A live view of one computer's health, in a terminal, in a browser, or through an AI assistant.
- dokku/dokku32k stars
A small platform you install on one server, which builds and runs an app every time you push code to it.
git clone https://github.com/uptrace/uptrace.git
cd uptrace/example/docker
docker compose up -d