1.5k stars · BSD-3-Clause · v0.6.8 (2026-02-16) · Track this in Rising ↗
Fifty indicators as DataFrame columns, under a licence you can actually ship.
Radar check
What we found when we opened it. Every bar is one fact, with its date.
Last code pushed 26 Oct 2026, one day before this check.
Latest release v0.6.10 on 26 Oct 2026.
Public since June 2016, a little over 10 years.
1,522 stars and 320 forks.
4 commits and 0 new issues in the last 90 days.
14 contributors. 4 pull requests merged in 90 days.
No security policy file says how to report a problem. No published security advisories.
How the bars are scored
- Alive. Days since the last code push: a week or less 100, a month 90, three months 70, six months 50, a year 30, eighteen months 15, older 0.
- Releases. Age of the latest GitHub release, on a similar scale; no bar when the project publishes no releases.
- Maturity. Age of the project: eight years 100, five 90, three 70, two 55, one 40, six months 25, younger 10.
- Adoption. Stars on a log scale: 100,000 stars is 100, 10,000 is 80, 1,000 is 60, 100 is 40.
- Activity. Commits in the last 90 days: 300 or more 100, 100 85, 30 65, 10 45, any 25.
- Community. People who have contributed: 100 or more 100, 30 80, 10 60, 5 40, 2 25, one 10.
- Security. A published security policy 80, none 40; published advisories are listed, not scored.
Checked by Repo Radar on 26 Oct 2026 from the repository on GitHub. Covered in Edition 10.
▶Repo detailsthe review · specs · pros & cons · install
What it does
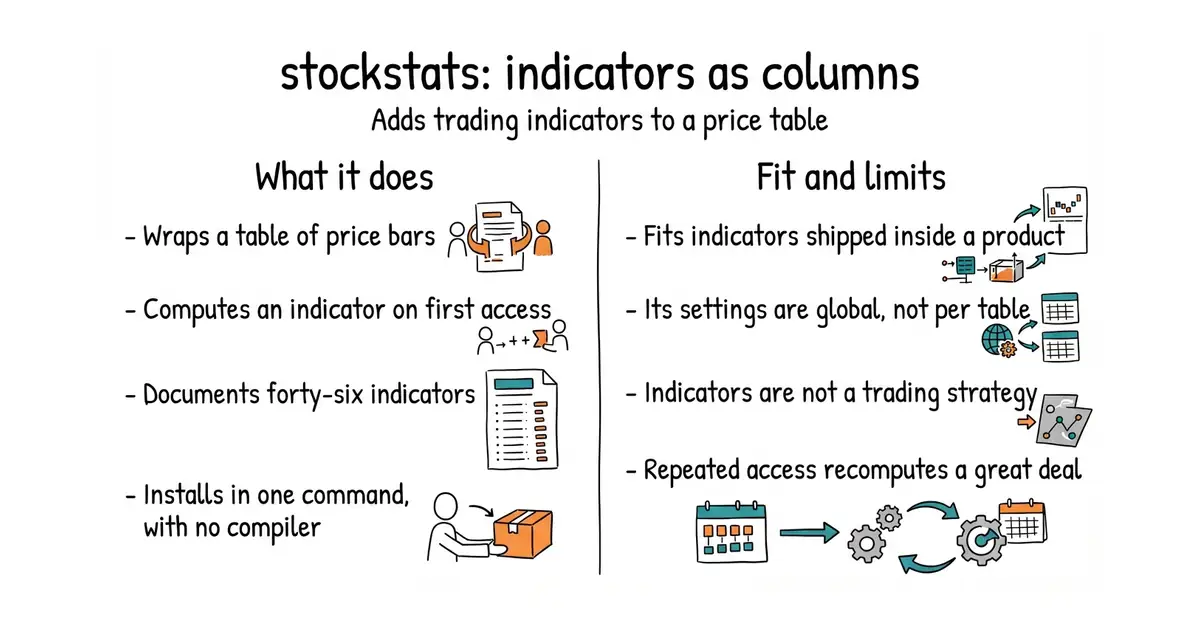
You wrap a table of open, high, low, close and volume values, either with wrap or with StockDataFrame.retype. After that, asking for a column computes the indicator behind it on first access and keeps the result. The naming is the whole interface: df['rsi'] and df['close_20_sma'] do what their names say. The summary table in the README documents forty-six indicators across momentum, trend, volatility and volume, plus a set of utilities for shifts, differences and comparisons. Deleting a column forces it to be recalculated. There are no compiled dependencies, so there is no C library to build first. What it does not do is behave per table: the configurable parameters are class-level and global, so changing one does not affect results already computed, and existing columns have to be deleted to re-evaluate them. The README also warns that init_all() generates a great many columns and should be used with caution.
Why it matters
Who it suits. Anyone computing a human-recognisable indicator the same way every time, especially inside a product that a paying customer looks at. The licence is the specific reason: BSD-3-Clause allows it to be shipped inside a commercial feature, which several better-known libraries in this corner do not. It also suits research code, because the column naming is small enough to remember. Skip it if an indicator library is already in place and working; this is a convenience, not a new capability.
Verdict. Worth twenty minutes, and the reason to pick it over the alternatives is almost entirely the licence and the lack of a compiler step. Three cautions. Version 0.6.8 was released on 16 February 2026, so eight months have passed without a release, although code landed on 28 September 2026, which makes it quiet rather than finished. Indicators are conveniences and not strategies, and computing forty-six of them is an easy way to feel productive without learning anything. And on years of minute-by-minute prices, casual column access recomputes far more than you expect, so cache deliberately. TA-Lib/ta-lib-python at 12,266 stars is the established alternative and needs a C library built first; bukosabino/ta at 5,100 stars is pure Python like this one.
Summary (Key Points)from the README
Key features
- Pandas wrapper: `StockDataFrame` wraps a `pandas.DataFrame` through `wrap` or `retype`, and `unwrap` converts it back.
- Lazy calculation: Indicators are computed on first access, and deleting a column forces it to be re-evaluated.
- Broad indicator set: The README lists moving averages, momentum, trend, volatility, volume and oscillator families, including SMA, MACD, RSI, Supertrend, Ichimoku, Bollinger Bands and OBV.
- Column naming patterns: Names such as `close_10_ema`, `high_-1_d` and `rsi_6` set the source column and window directly.
- Default windows: Common defaults include RSI 14, MACD 12/26/9, Bollinger 20, Supertrend 14 with a multiplier of 3, and KDJ 9.
- Multi-line outputs: One indicator can produce several columns, for example `macd`, `macds` and `macdh` for MACD, or `boll_ub` and `boll_lb` for Bollinger Bands.
- Signal detection: The `x`, `xu` and `xd` patterns flag crosses, such as `kdjk_xu_kdjd` for an upward cross.
- Utilities: Delta, shift, log return, comparisons, non-zero counts and max/min over a range of periods are available as column patterns.
Important
- Input columns: Data needs `close`, `high`, `low` and `volume` columns (case-insensitive). `date` is optional and used as the index by default.
- Heavy column generation: `df.init_all()` creates many columns at once, so the README advises using it with caution.
- Global parameter changes: Class-level settings apply globally and do not affect existing results. Remove the affected columns to have them recalculated.
- MACDH formula change: In July 2017 the MACDH calculation dropped an extra 2x multiplier, so older results may differ.
- Partial Ichimoku: The implementation returns only the cloud width (leading span A minus leading span B), not the full cloud.
- Python version: The package requires Python 3.9 or newer. CI tests Python 3.10 through 3.13.
- License: BSD-3-Clause.
- Bug reports: Issues are tracked through GitHub Issues.
Written by an AI model from the project’s README; not part of the review, and it can be wrong.
- BSD-3-Clause, so it can be shipped inside a commercial feature.
- No C library to compile, which removes the usual install wall on a plain machine.
- The column naming is small and predictable, so the calling code stays short.
- Configurable parameters are global rather than per table, which surprises people once.
- Eight months since the last release, with eleven issues open and a small maintainer team.
- Repeated column access on a long price history recomputes more than it looks like it does.
This is that layer, it installs in one command, and BSD-3-Clause means it can sit inside a paid product screen, unlike backtesting.py (AGPL) or vectorbt (Commons Clause).
Sits directly beside existing pandas loading code.
python3 -m venv venv
source venv/bin/activate
pip install stockstats