In simple English
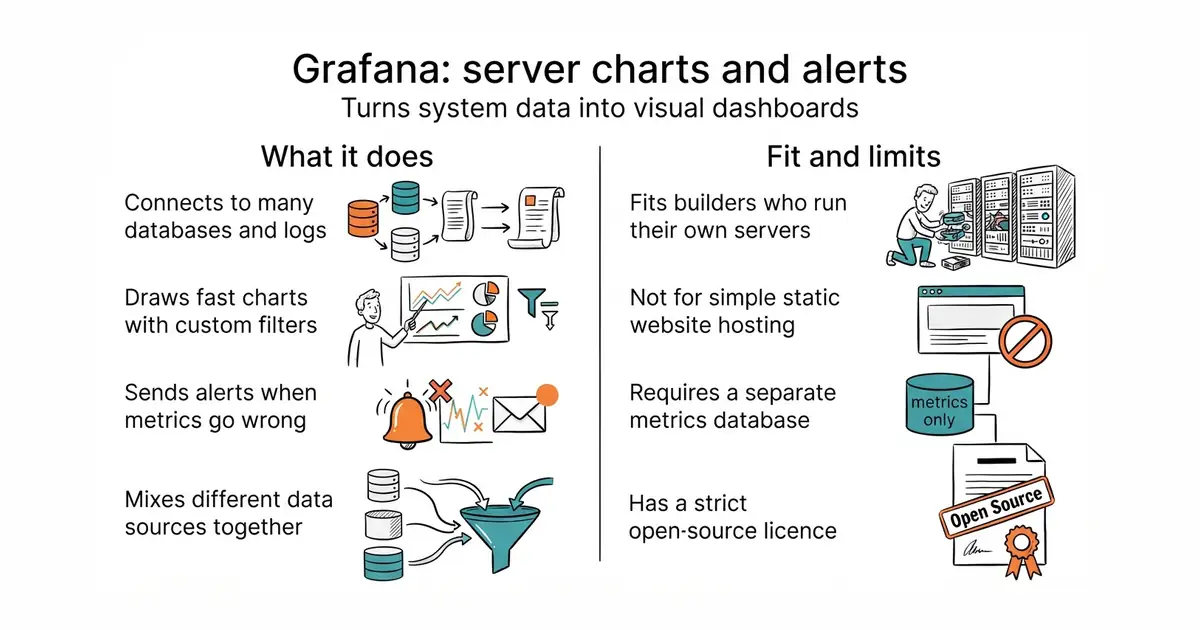
This tool collects numbers from your servers and databases and turns them into charts. You can build screens that show if your website is fast or slow. It warns you on chat apps when something breaks. It is free to run on your own server, but takes time to set up and configure. Large companies also pay for managed versions.
What it is
Grafana is a web application for data visualization and alerting that connects to databases like PostgreSQL (a powerful, open-source SQL database for storing application data), Prometheus (a monitoring system that collects and stores numbers over time), and Elasticsearch (a search engine for quickly finding text and logs across large datasets). It reads your data and displays it on custom screens with graphs, maps, and status lights.
What it is good for
Solo builders who need to watch server performance, track user signups, or check error logs in one place without building custom admin panels.
- Connects to dozens of different databases and monitoring tools at the same time.
- Lets you build clean charts with dropdown filters for different projects or servers.
- Sends instant alerts to chat tools when numbers go above or below your limits.
- Setup is complex because you need to run the database storage separately.
- Uses significant memory if you load many large dashboards at once.
- Uses the AGPL-3.0 licence (a strict open-source licence requiring you to share your code if you host it as a paid service for others).
custom admin pages and manual server checking
Prometheus
- netdata/netdata81k stars
Netdata monitors server health out of the box, while Grafana requires you to set up your own data collection.
- prometheus/prometheus67k stars
Prometheus stores the time-series numbers, while Grafana is the screen that draws the charts for them.


- slok/sloth2.6k stars
Generates Prometheus alerting and recording rules from a short specification of a service level objective.
- nicolargo/glances34k stars
A live view of one computer's health, in a terminal, in a browser, or through an AI assistant.
- dokku/dokku32k stars
A small platform you install on one server, which builds and runs an app every time you push code to it.
docker run -d -p 3000:3000 --name=grafana grafana/grafana