In simple English
This tool helps you collect data from many different places. You write simple commands to search through your information. It turns your numbers into clear charts and graphs. You can share these charts with your team in a web browser. It costs nothing to download and run on your own server.
What it is
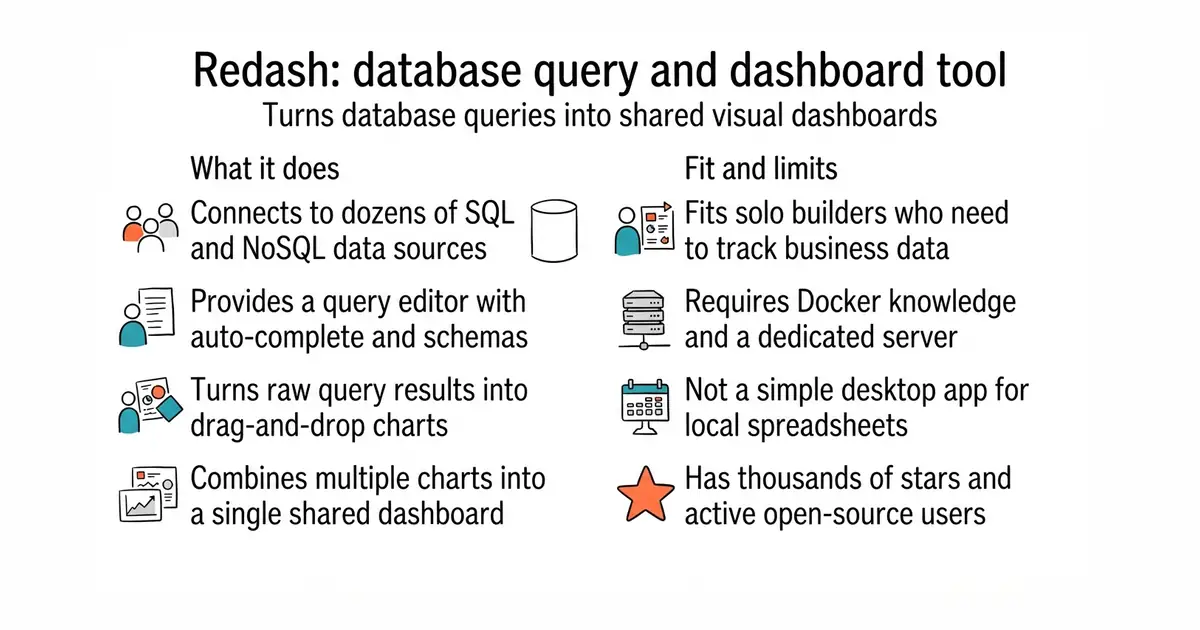
Redash is a web-based application for querying databases and building visual dashboards. It connects to dozens of popular data sources and lets you share reports through simple links.
What it is good for
Solo builders who want to track sales, website traffic, and app usage in one place without buying expensive analytics software.
- Connects to more than thirty different databases and data sources.
- Turns raw SQL queries into drag-and-drop charts and shared dashboards.
- Runs entirely in your web browser with a REST API for automation.
- Setup requires Docker (a way to run a program inside its own sealed box, so it cannot break anything else on your server) and some server management skill.
- Needs at least 2 GB of RAM to run smoothly, so check your server has room.
- Large open issue count on GitHub means you may wait for bug fixes.
Metabase or building custom internal dashboards by hand.
PostgreSQL (a robust, open-source SQL database for storing application data)
- metabase/metabase50k stars
An alternative business intelligence tool with a friendly visual query builder.

- harlan-zw/nuxt-seo1.5k stars
Seven search-engine and answer-engine modules for Nuxt sites, installed as one package.
- Swetrix/swetrix1.2k stars
Website analytics with no cookies, plus performance monitoring and error tracking, which you can host yourself.
- plausible/analytics30k stars
Cookie-free website visitor counting that you run yourself, with a single-page report.
Follow the official setup guide at redash.io/help/open-source/setup to run Redash using Docker.