In simple English
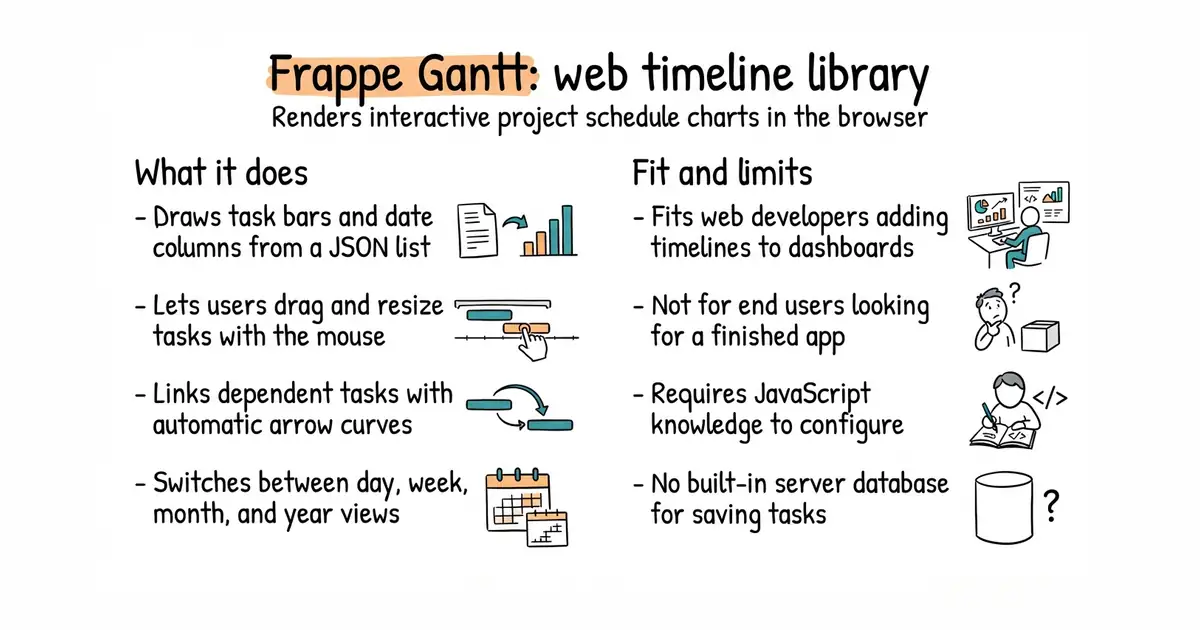
This tool helps you draw project timelines on a web page. You feed it a list of tasks with start dates and end dates. It draws a clear bar chart showing who does what and when. You can change how it looks or let users drag tasks around with the mouse. It is free to use on any website.
What it is
Frappe Gantt (a JavaScript library that adds interactive project schedule charts to web pages) is a lightweight component for developers. It lets you display timelines, track task progress, and link dependent jobs without heavy software.
What it is good for
Solo builders who need to show project roadmaps, editorial calendars, or task schedules inside their web application without building a chart from scratch.
- Clean visual design that looks good by default.
- Supports dragging and resizing tasks directly in the browser.
- Easy to install via npm or a content delivery network.
- Requires JavaScript knowledge to integrate into a page.
- No built-in backend database storage for saving user changes.
- Limited to bar chart timelines and cannot do complex resource allocation.
Writing custom SVG timeline code or using heavy commercial project management widgets.
A frontend framework like React or Vue to build the rest of the project dashboard.
- DHTMLX/gantt1.9k stars
A feature-rich commercial Gantt chart library with advanced enterprise planning tools.

- GoogleChromeLabs/squoosh26k stars
A web page that compresses images in the browser and shows you the result before you save it.
- simple-icons/simple-icons26k stars
More than 3,400 brand logos as single-colour SVG files, released into the public domain.
- phosphor-icons/core394 stars
The raw SVG files and the catalogue for the Phosphor icon family, with no framework package attached.
npm install frappe-gantt