Overview
Summary
The useful answer before the supporting detail.
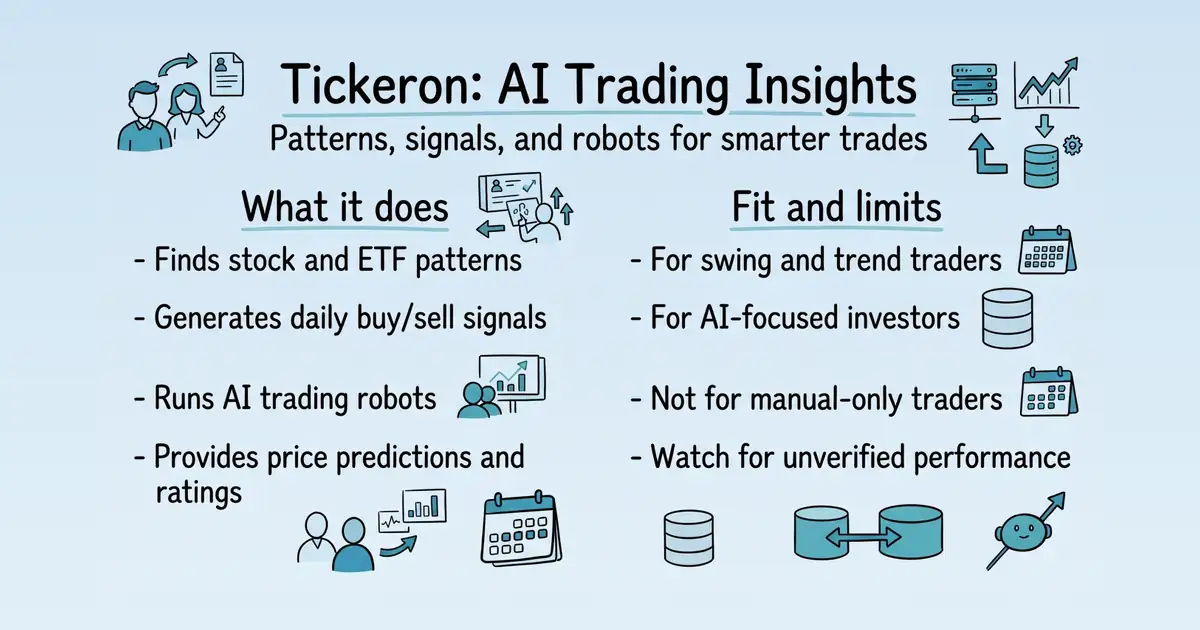
Tickeron is an AI-powered platform that helps traders discover stock and ETF patterns, receive daily buy/sell signals, and access AI-driven trading robots S1 S10. It solves the problem of identifying profitable trading opportunities in complex market data by using machine learning to generate trade ideas and price predictions S1 S10. The practical value is providing automated, data-driven insights that help traders make more informed decisions S10.
Product identity and positioning
Name, category, positioning, audience, and first-party claims.
- Identity: Tickeron is an AI-driven trading analysis platform offering pattern search, signals, and robots S1 S10.
- Core purpose: It helps traders find profitable stock and ETF patterns and generate trade ideas S1 S10.
- Intended users: Swing traders and investors seeking end-of-day trade ideas and market insights S10.
- Product scope: A web application with multiple tools including Pattern Search Engine, Daily Buy/Sell Signals, AI Robots, and RTP S1 S10.
- Positioning: Tickeron positions itself as providing accurate and secured AI tools for stock forecasts and price predictions S10.
- Claimed distinction: It uses AI to discover hidden effects in trading patterns, offering a sophisticated approach to trading S1.
Use cases and audiences
Who the product serves and the jobs it is designed to handle.
| Audience | Practical use case |
|---|---|
| Swing traders | Receive end-of-day trade ideas for stocks and ETFs to capitalize on short-term price movements S10. |
| Trend traders | Analyze continuation of existing market trends to make informed trading decisions S10. |
| Investors in AI sector | Use AI robots focused on companies building AI infrastructure to identify opportunities S10. |
| ETF traders | Leverage AI robots optimized for leveraged ETFs with advanced risk management S10. |
| Market researchers | Research markets and AI-generated trade ideas to support investment strategies S10. |
Traffic and search
SEO analysis
Collected Oct 23, 2026tickeron.com: an estimated 213,864 total monthly visits and about 183,733 monthly organic visits across 59,898 ranking keywords. Scout crawled 15 pages and measured a technical health score of 97/100.
Search summary
The useful answer before the supporting detail.
Tickeron's accurate & secured AI tools provide accurate stock forecasts and price predictions. Explore our AI trading to maximize your investment success! tickeron.com: an estimated 213,864 total monthly visits and about 183,733 monthly organic visits across 59,898 ranking keywords. Scout crawled 15 pages and measured a technical health score of 97/100.
- Total traffic (modeled): 213,864 monthly visits across all channels.
- Organic search traffic (estimated): 183,733 monthly visits from search.
- Strongest sampled ranking: amd stock price vs nvidia at position 1.
- Leading page in the collected evidence: https://tickeron.com/compare/AMD-vs-NVDA/.
- Closest measured organic competitor: finance.yahoo.com, appearing 2 times in the sampled first-page SERPs.
- Technical crawl: 15 pages, health score 97/100.
Website intelligence — Collected evidence
Company identity and positioning
| Page type | Evidence | Source |
|---|---|---|
| pricing | Tickeron's accurate & secured AI tools provide accurate stock forecasts and price predictions. Explore our AI trading to maximize your investment success! | https://tickeron.com/ |
Domain performance
Modeled total traffic, six-month trend, engagement, countries, and domain identity.
Total website traffic
| Month | Modeled visits |
|---|---|
| 2026-04 | 307,833 |
| 2026-05 | 294,022 |
| 2026-06 | 265,104 |
| 2026-07 | 258,174 |
| 2026-08 | 254,129 |
| 2026-09 | 213,864 |
Top visitor countries
| Country | Name | Traffic share |
|---|---|---|
| US | United States | 50.8% |
| CA | Canada | 3.3% |
| SK | Slovakia | 2.8% |
| IN | India | 2.5% |
| IT | Italy | 2.1% |
Domain identity
| Signal | Value |
|---|---|
| Registered | Mar 28, 2011 |
| Last changed | May 16, 2026 |
| Expires | Feb 26, 2029 |
| WHOIS server | whois.verisign-grs.com |
| DNSSEC | Not signed |
| Nameservers | HAYES.NS.CLOUDFLARE.COM, NOVALEE.NS.CLOUDFLARE.COM |
Website capture

Organic keywords
Top keywords and an independent Google result page.
Top organic keywords
| Keyword | Volume | CPC | Estimated value |
|---|---|---|---|
| tickeron | 2,330 | $5.63 | $1,800 |
| mms town | 1,860 | $0.00 | $1,530 |
| fear and greed index | 114,660 | $1.98 | $610 |
| fcx stock | 17,900 | $2.28 | $470 |
| ai trading bot | 13,540 | $7.85 | $390 |
Independent Google result page
Query: amd stock price vs nvidia
| Position | Title | URL | Description |
|---|---|---|---|
| 1 | AMD vs. Nvidia: Which AI Stock Is the Better Buy? | https://finance.yahoo.com/markets/stocks/articles/amd-vs-nvidia-ai-stock-035909345.html | AMD traded at about 55.6 times forward earnings versus 18.7 times for Nvidia. The challenger carries the richer multiple. AMD Trades at 63x ... |
| 2 | AMD vs NVDA - Comparison tool | https://tickeron.com/compare/AMD-vs-NVDA/ | , more range-bound price action. Stock price -- (AMD: $552.72 vs. NVDA: $221.97) AMD: $902.3B vs. NVDA: $5.36T |
| 3 | AMD vs. NVDA — Stock Comparison Tool | https://stockanalysis.com/stocks/compare/amd-vs-nvda/ | AMD returned a total of 129.76%, which is significantly higher than NVDA's 21.83% return. AMD has had annualized average returns of 54.89%, compared to 63.16% ... |
| 4 | AMD vs NVIDIA — how do value investors think about the ... | https://www.reddit.com/r/ValueInvesting/comments/1revsl4/amd_vs_nvidia_how_do_value_investors_think_about/ | NVIDIA has clearly established dominance in AI and commands a much higher valuation multiple. AMD is also growing in data center and AI, but trades at ... |
| 5 | NVDA vs AMD stock comparison tool | https://fullratio.com/stocks/compare/nasdaq-nvda/nasdaq-amd | NVIDIA vs AMD Advanced Micro Devices NVDA AMD Price (delayed) $217.475 $543.41 Market cap $5.24T $887.1B P/E Ratio $0.52 N/A EPS $7.95 $3.94 |
| 6 | Nvidia vs. AMD: Which AI Chip Stock Has More Room to ... | https://www.fool.com/investing/2026/09/29/nvidia-vs-amd-which-ai-chip-stock-has-more-room-to/ | AMD stock has rallied 195% this year while its rival, Nvidia (NVDA -4.40%), has gained closer to 20%. The disparity between these share price ... |
| 7 | NVDA (NVIDIA Corp) vs AMD (Advanced Micro Devices ... | https://www.alphaspread.com/comparison/nasdaq/nvda/vs/nasdaq/amd | NVDA. vs. AMD ... Over the past 12 months, NVDA has underperformed AMD, delivering a return of +20% compared to AMD's +134% growth. |
| 8 | NVDA vs AMD: Performance Charts & Full Comparison | https://portfolioslab.com/tools/stock-comparison/NVDA/AMD | The current volatility for NVIDIA Corporation (NVDA) is 6.70%, while Advanced Micro Devices, Inc. (AMD) has a volatility of 12.04%. This indicates that NVDA ... |
| 9 | Best Stock to Buy: Nvidia Stock or AMD Stock? | https://www.youtube.com/watch?v=0nKHUI2Q_a8&vl=en-US | Nvidia and AMD are two of the best semiconductor companies in the world, but only one can be the better stock to buy in this comparison. |
| 10 | NVDA vs. AMD vs. INTC: Chip Stocks Comparison & Ratings | https://www.tipranks.com/compare-stocks/amd-vs-intc-vs-nvda | Comparison Results ; AMD. Technology, $507.93 ; INTC. Technology, $85.48 ; NVDA. Technology, $212.21 ... |
Important pages
Pages earning the most estimated search traffic in the sample.
Website intelligence — Collected evidence
Prioritized website intelligence pages
| Type | Page | Words | Change | URL |
|---|---|---|---|---|
| pricing | AI Tools for Stock Forecasts & Price Predictions \ | playwright | 1,134 | new |
| pricing | Cypherpunk Technologies Inc. (CYPH): Examining the $4.90 Price Target in a Crypto-Driven Market | 4,323 | new | https://tickeron.com/blogs/cypherpunk-technologies-inc-cyph-examining-the-4-90-price-target-in-a-crypto-driven-market-20168/ |
| pricing | Primis Financial (FRST) Q3 2026 Earnings Preview: Recovery Trends and Digital Core Plans | 4,345 | new | https://tickeron.com/blogs/primis-financial-frst-q3-2026-earnings-preview-recovery-trends-and-digital-core-plans-20871/ |
| pricing | Tesla (TSLA, $729.45) gets rating upgrade, price target boost from Credit Suisse | 3,814 | new | https://tickeron.com/blogs/tesla-tsla-729-45-gets-rating-upgrade-price-target-boost-from-credit-suisse-7033/ |
| pricing | Periodic Distributions from Pension Plans: A Guide for Retirees | 2,491 | new | https://tickeron.com/trading-investing-101/can-i-take-periodic-distribution-from-pension-plan/ |
| pricing | Money Purchase/Profit Sharing Plans: Employee Inclusion | 2,429 | new | https://tickeron.com/trading-investing-101/if-i-want-establish-money-purchaseprofit-sharing-plan-do-i-have-establish-one-all-employees/ |
| pricing | Can Applied Optoelectronics (AAOI) Stock Reach $150? | 2,101 | new | https://tickeron.com/ticker/AAOI/price-charts/ |
| pricing | Can AngioDynamics (ANGO) Stock Reach $20? | 1,818 | new | https://tickeron.com/ticker/ANGO/price-charts/ |
| pricing | Can Apimeds Pharmaceuticals US (APUS) Stock Reach $20? | 1,596 | new | https://tickeron.com/ticker/APUS/price-charts/ |
| pricing | Can AST SpaceMobile (ASTS) Stock Reach $80? | 1,600 | new | https://tickeron.com/ticker/ASTS/price-charts/ |
| pricing | Can AXT, Inc. (AXTI) Stock Reach $90? | 1,561 | new | https://tickeron.com/ticker/AXTI/price-charts/ |
| pricing | Can Fly-E Group (FLYE) Stock Reach $2.00? | 1,603 | new | https://tickeron.com/ticker/FLYE/price-charts/ |
| pricing | Pacira BioSciences (PCRX) Stocks Price History Chart, Support & Resistance Graph - Tickeron.com | 506 | new | https://tickeron.com/ticker/PCRX/price-charts/ |
| pricing | Can Pinnacle Food Group (PFAI) Stock Reach $4.75? | 1,738 | new | https://tickeron.com/ticker/PFAI/price-charts/ |
| pricing | Can Resources Connection (RGP) Stock Reach $5.70? | 1,599 | new | https://tickeron.com/ticker/RGP/price-charts/ |
Features
No supporting public-page evidence was collected for this category.
Pricing and plans
| Page type | Evidence | Source |
|---|---|---|
| pricing | Pricing | https://tickeron.com/ |
| pricing | Try for Free | https://tickeron.com/ |
| pricing | Try for Free | https://tickeron.com/ |
| pricing | Join Us Today for Free | https://tickeron.com/ |
| pricing | Join For Free | https://tickeron.com/ |
| pricing | \-$0.35 (-10.51%) | https://tickeron.com/blogs/cypherpunk-technologies-inc-cyph-examining-the-4-90-price-target-in-a-crypto-driven-market-20168/ |
| pricing | Pricing | https://tickeron.com/blogs/cypherpunk-technologies-inc-cyph-examining-the-4-90-price-target-in-a-crypto-driven-market-20168/ |
| pricing | Cypherpunk Technologies Inc. (CYPH): Examining the $4.90 Price Target in a Crypto-Driven Market | https://tickeron.com/blogs/cypherpunk-technologies-inc-cyph-examining-the-4-90-price-target-in-a-crypto-driven-market-20168/ |
| pricing | The central target of $4.90 implies a rise of roughly 74% from the last verified close near $2.81. | https://tickeron.com/blogs/cypherpunk-technologies-inc-cyph-examining-the-4-90-price-target-in-a-crypto-driven-market-20168/ |
| pricing | Coverage is extremely thin: essentially one current analyst target (Cantor Fitzgerald at $4.90, set September 10, 2026) underpins the figure, so it is not a broad analyst consensus. | https://tickeron.com/blogs/cypherpunk-technologies-inc-cyph-examining-the-4-90-price-target-in-a-crypto-driven-market-20168/ |
| pricing | The recent 52-week high of $4.19 (September 25, 2026) sits between the current price and the target, meaning $4.90 requires a breakout to a new high. | https://tickeron.com/blogs/cypherpunk-technologies-inc-cyph-examining-the-4-90-price-target-in-a-crypto-driven-market-20168/ |
| pricing | Establishing the $4.90 Target | https://tickeron.com/blogs/cypherpunk-technologies-inc-cyph-examining-the-4-90-price-target-in-a-crypto-driven-market-20168/ |
| pricing | CYPH does not have a deep, multi-firm analyst coverage universe. The only current, attributable price target is from Cantor Fitzgerald, where analyst Nathan Frankovitz raised the target to $4.90 from $1.60 on September 10, 2026, while reiterating an Overweight rating. The firm cited "recent momentum in the crypto markets" as the reason for the increase. A prior Cantor figure of $1.60 and an older, pre-rebrand target from another firm (HC Wainwright, from January 2025) are stale and are not usable here. Accordingly, the $4.90 level should be read as a single firm's published objective rather than a formal "analyst consensus." For context, a third-party aggregator showed a low of $1.60, an average of $3.25, and a high of $4.90 — but that average simply blends Cantor's old and new targets from the same analyst, so it is not a meaningful multi-analyst mean. I also checked this using Tickeron’s AI Screener to see how the stock compares to others in the industry. | https://tickeron.com/blogs/cypherpunk-technologies-inc-cyph-examining-the-4-90-price-target-in-a-crypto-driven-market-20168/ |
| pricing | Shares closed near $2.81 on October 20, 2026, with a 52-week range of roughly $0.39 to $4.19. Reaching $4.90 would require a gain of about 74%, which is a very large move by any standard. The path runs through the stock's own recent history: CYPH rallied sharply earlier in 2026 — gaining roughly 280% over three months at one point — touched $4.19 in late September, then pulled back more than 30% as crypto momentum cooled. Because the company's treasury model means its share price tracks Zcash prices and overall digital-asset sentiment, the route to $4.90 is less about quarterly earnings and more about whether cryptocurrency markets resume their upward trend. | https://tickeron.com/blogs/cypherpunk-technologies-inc-cyph-examining-the-4-90-price-target-in-a-crypto-driven-market-20168/ |
| pricing | Bullish analyst action: The September target raise from $1.60 to $4.90 signaled a sharp improvement in the firm's outlook. | https://tickeron.com/blogs/cypherpunk-technologies-inc-cyph-examining-the-4-90-price-target-in-a-crypto-driven-market-20168/ |
| pricing | The most relevant reference points are the 52-week high of $4.19, which now acts as resistance, and the $4.00 psychological level. Any sustained move toward $4.90 must first reclaim and hold above $4.19 — a level the stock failed to hold in late September. On the downside, the stock has consolidated around the $2.40–$2.50 area in recent sessions, a near-term support zone, with the broader 52-week low near $0.39. The current price sits roughly one-third below its recent high, leaving substantial overhead supply to work through. From what I see, monitoring these levels alongside broader crypto moves is essential. | https://tickeron.com/blogs/cypherpunk-technologies-inc-cyph-examining-the-4-90-price-target-in-a-crypto-driven-market-20168/ |
| pricing | Following a 3-day decline, the stock is projected to fall further. Considering past instances where CYPH declined for three days, the price rose further in 50 of 62 cases within the following month. The odds of a continued downward trend are 90%. | https://tickeron.com/blogs/cypherpunk-technologies-inc-cyph-examining-the-4-90-price-target-in-a-crypto-driven-market-20168/ |
| pricing | Following a +31.62% 3-day Advance, the price is estimated to grow further. Considering data from situations where CYPH advanced for three days, in 215 of 241 cases, the price rose further within the following month. The odds of a continued upward trend are 89%. | https://tickeron.com/blogs/cypherpunk-technologies-inc-cyph-examining-the-4-90-price-target-in-a-crypto-driven-market-20168/ |
| pricing | The Aroon Indicator entered an Uptrend today. In 129 of 149 cases where CYPH Aroon's Indicator entered an Uptrend, the price rose further within the following month. The odds of a continued Uptrend are 87%. | https://tickeron.com/blogs/cypherpunk-technologies-inc-cyph-examining-the-4-90-price-target-in-a-crypto-driven-market-20168/ |
| pricing | The Tickeron Seasonality Score of 75 (best 1 - 100 worst) indicates that the company is slightly overvalued in the industry. The Tickeron Seasonality score describes the variance of predictable price changes around the same period every calendar year. These changes can be tied to a specific month, quarter, holiday or vacation period, as well as a meteorological or growing season. | https://tickeron.com/blogs/cypherpunk-technologies-inc-cyph-examining-the-4-90-price-target-in-a-crypto-driven-market-20168/ |
Integrations and supported platforms
No supporting public-page evidence was collected for this category.
Product and company updates
No supporting public-page evidence was collected for this category.
Rank tracking
Persistent keyword baselines and position movement.
This analysis created the first position baseline at 2026-10-23T06:53:50.097Z. Movement appears after the next fresh analysis using the same location and language.
Features
Features and capabilities
Core functions and evidence-backed product capabilities.
| Capability | What it does |
|---|---|
| Pattern Search Engine | Finds profitable stock and ETF patterns using AI, allowing users to track candlestick and chart patterns S1. |
| Daily Buy/Sell Signals | Provides end-of-day trade ideas for stocks and ETFs, including breakout and target prices S10. |
| AI Robots | Machine learning systems that generate several trade ideas per day, with specialized robots for sectors like AI infrastructure and leveraged ETFs S10. |
| RTP (Real-Time Price) | Finds entry and exit prices for stocks and ETFs instantly S10. |
| Notifications | Alerts users to fixed prices, buy/sell signals, earnings reports, and other market events S10. |
| Trending AI Robots | Curates the strongest-performing AI trading bots from hundreds of strategies covering thousands of tickers S56. |
| Fundamental Analysis Ratings | Provides ratings like Price Growth, PE Growth, and Valuation to assess stock performance S35. |
Integrations and ecosystem
Connected products, exports, APIs, and workflow compatibility.
| Integration or interface | Type | What it enables |
|---|---|---|
| Web application | Platform | Provides access to all Tickeron tools including pattern search, signals, and robots via browser S1 S10. |
| AI Robots | AI interface | Users can deploy machine learning systems that generate trade ideas automatically S10. |
| Trending AI Robots page | Extension framework | Curates and highlights the strongest-performing AI trading bots from a larger universe S56. |
| Notifications | API | Sends alerts for price changes, buy/sell signals, and earnings reports S10. |
| Fundamental Analysis Ratings | Data interface | Provides proprietary ratings like Price Growth and PE Growth for stock evaluation S35. |
Pricing
Pricing and plans
Published plans, free access, trials, credits, and pricing limitations.
| Plan or offer | Verified price and billing | Included | Limits |
|---|---|---|---|
| Free Account | Free sign-up offered S1 S10 | Not established | Not established |
| Pattern Search Engine Trial | 14 days free, then $30/month S1 | Not established | Not established |
| Intermediate One (60min) | Not published | Not published | Plan names shown on AI agents page; prices only after sign-up S10 |
| Intermediate Two (15min) | Not published | Not published | Not published S10 |
| Expert (5min) | Not published | Not published | Not published S10 |
Competition
Competitive landscape
Domains competing for the same organic search demand.
Sampled competitors
| Competitor | First-page appearances | Sampled queries | Average position | Queries observed |
|---|---|---|---|---|
| finance.yahoo.com | 2 | 2 | 3.5 | amd stock price vs nvidia, altima energy stock price prediction |
| barrons.com | 2 | 2 | 4 | amd stock price vs nvidia, altima energy stock price prediction |
| investing.com | 1 | 1 | 2 | amd stock price vs nvidia |
| moomoo.com | 1 | 1 | 2 | altima energy stock price prediction |
| youtube.com | 1 | 1 | 3 | amd stock price vs nvidia |
| theglobeandmail.com | 1 | 1 | 3 | altima energy stock price prediction |
| stockrow.com | 1 | 1 | 4 | amd stock price vs nvidia |
| otcmarkets.com | 1 | 1 | 4 | altima energy stock price prediction |
| tipranks.com | 1 | 1 | 5 | amd stock price vs nvidia |
| msn.com | 1 | 1 | 5 | altima energy stock price prediction |
Website intelligence — Collected evidence
Customers, testimonials, and first-party review claims
No supporting public-page evidence was collected for this category.
Independent review sources discovered
| Platform | Status | Discovered source |
|---|---|---|
| discovered_not_scraped | https://play.google.com/store/apps/details?id=com.tickeron.mobile&gl | |
| discovered_not_scraped | https://play.google.com/store/apps/details?id=com.tickeron.mobile |
AI visibility
Measured ChatGPT and Google AI mentions with cited sources.
AI-assistant referral traffic
- Estimated current generative-AI referral share: 2.0%
| Month | Traffic share | Source |
|---|---|---|
| — | — | All AI assistants |
Website intelligence — Collected evidence
Site-stated AI capabilities
| Page type | Evidence | Source |
|---|---|---|
| pricing | Tickeron's accurate & secured AI tools provide accurate stock forecasts and price predictions. Explore our AI trading to maximize your investment success! | https://tickeron.com/ |
| pricing | CYPH does not have a deep, multi-firm analyst coverage universe. The only current, attributable price target is from Cantor Fitzgerald, where analyst Nathan Frankovitz raised the target to $4.90 from $1.60 on September 10, 2026, while reiterating an Overweight rating. The firm cited "recent momentum in the crypto markets" as the reason for the increase. A prior Cantor figure of $1.60 and an older, pre-rebrand target from another firm (HC Wainwright, from January 2025) are stale and are not usable here. Accordingly, the $4.90 level should be read as a single firm's published objective rather than a formal "analyst consensus." For context, a third-party aggregator showed a low of $1.60, an average of $3.25, and a high of $4.90 — but that average simply blends Cantor's old and new targets from the same analyst, so it is not a meaningful multi-analyst mean. I also checked this using Tickeron’s AI Screener to see how the stock compares to others in the industry. | https://tickeron.com/blogs/cypherpunk-technologies-inc-cyph-examining-the-4-90-price-target-in-a-crypto-driven-market-20168/ |
| pricing | AMD has surged roughly 200% year to date, crossing a $1 trillion market capitalization on AI data-center demand and a "CPU renaissance" narrative. KLAC has gained about 71% year to date, supported by record process-control revenue and rapid growth in advanced packaging for AI chips. | https://tickeron.com/blogs/cypherpunk-technologies-inc-cyph-examining-the-4-90-price-target-in-a-crypto-driven-market-20168/ |
| pricing | AMD is a large-cap semiconductor designer riding explosive AI compute demand, while ENTG is a mid-cap supplier of materials and purity solutions that feed the same AI-driven chip cycle. AMD recently crossed a $1 trillion market capitalization on surging data center revenue, whereas ENTG operates at a far smaller scale (roughly $23 billion) with steadier, double-digit growth. | https://tickeron.com/blogs/cypherpunk-technologies-inc-cyph-examining-the-4-90-price-target-in-a-crypto-driven-market-20168/ |
| pricing | Primis Financial Corp., the McLean, Virginia-based holding company for Primis Bank, has rebuilt its earnings momentum after a challenging 2024, driven by a diversified mix of community banking, mortgage, mortgage warehouse lending, and the Panacea Financial division. The upcoming report matters because it tests whether that recovery can continue across multiple business lines at once. With the company planning a conversion of its entire bank to a digital, real-time core system beginning in the fourth quarter of 2026—a move management expects to unlock about $6.1 million in earnings enhancements—the third quarter serves as an important benchmark for the operating trends investors will watch next. I also checked this using Tickeron’s AI Screener to see how the stock compares to others in the industry. | https://tickeron.com/blogs/primis-financial-frst-q3-2026-earnings-preview-recovery-trends-and-digital-core-plans-20871/ |
| pricing | AMD has surged roughly 200% year to date, crossing a $1 trillion market capitalization on AI data-center demand and a "CPU renaissance" narrative. KLAC has gained about 71% year to date, supported by record process-control revenue and rapid growth in advanced packaging for AI chips. | https://tickeron.com/blogs/primis-financial-frst-q3-2026-earnings-preview-recovery-trends-and-digital-core-plans-20871/ |
| pricing | AMD is a large-cap semiconductor designer riding explosive AI compute demand, while ENTG is a mid-cap supplier of materials and purity solutions that feed the same AI-driven chip cycle. AMD recently crossed a $1 trillion market capitalization on surging data center revenue, whereas ENTG operates at a far smaller scale (roughly $23 billion) with steadier, double-digit growth. | https://tickeron.com/blogs/primis-financial-frst-q3-2026-earnings-preview-recovery-trends-and-digital-core-plans-20871/ |
| pricing | VIEW FOR FREEVIEW FOR FREE | https://tickeron.com/blogs/tesla-tsla-729-45-gets-rating-upgrade-price-target-boost-from-credit-suisse-7033/ |
| pricing | AMD has surged roughly 200% year to date, crossing a $1 trillion market capitalization on AI data-center demand and a "CPU renaissance" narrative. KLAC has gained about 71% year to date, supported by record process-control revenue and rapid growth in advanced packaging for AI chips. | https://tickeron.com/blogs/tesla-tsla-729-45-gets-rating-upgrade-price-target-boost-from-credit-suisse-7033/ |
| pricing | AMD is a large-cap semiconductor designer riding explosive AI compute demand, while ENTG is a mid-cap supplier of materials and purity solutions that feed the same AI-driven chip cycle. AMD recently crossed a $1 trillion market capitalization on surging data center revenue, whereas ENTG operates at a far smaller scale (roughly $23 billion) with steadier, double-digit growth. | https://tickeron.com/blogs/tesla-tsla-729-45-gets-rating-upgrade-price-target-boost-from-credit-suisse-7033/ |
These are first-party product claims, not independent measurements of AI-search visibility.
Marketing opportunities
Actions calculated directly from the collected evidence.
| Opportunity | Recommended action | Evidence |
|---|---|---|
| Competitor gap | Review the sampled queries where finance.yahoo.com appears. | 2 first-page appearances across amd stock price vs nvidia, altima energy stock price prediction |
Website intelligence — Collected evidence
Website evidence gaps
- features: no usable public page was collected; verify whether the site publishes this evidence.
- integrations: no usable public page was collected; verify whether the site publishes this evidence.
- customers: no usable public page was collected; verify whether the site publishes this evidence.
- reviews: no usable public page was collected; verify whether the site publishes this evidence.
- changes: no usable public page was collected; verify whether the site publishes this evidence.
- identity: no usable public page was collected; verify whether the site publishes this evidence.
- technical: no usable public page was collected; verify whether the site publishes this evidence.
Trust and proof
Customers, proof, and reviews
Published proof, customer signals, and review evidence.
Independent reviews
No citation-grounded independent review links were found.
Customer proof
No named customers, testimonials, or customer case studies were found.
Independent mentions
- AI Tools for Stock Forecasts & Price Predictions / Tickeron — AI Tools for Stock Forecasts & Price Predictions / Tickeron ... # AI Trading Agents, Tools and News ... ## AI-Powered Stock Analysis, Forecasts, and Trading Signals — all in One Platform ... ### Why Did a Stock Move Today? AI Knows in Seconds ... - Finding out why a stock moved shouldn't require searching through dozens of news articles, earnings reports, analyst notes, SEC filings, and social media posts - View recent significant moves: ... ### Trending AI Robots 30 selected out of 298 total ..
External links were grounded in one live web search. Search snippets are leads, not independently scraped page content; rejected links remain available in Review evidence.
Company, security, and trust
Ownership, policies, security signals, and public trust evidence.
| Signal | Finding | Source |
|---|---|---|
| Company and ownership | Discover stocks identified by AI based on momentum, sector leadership, and emerging trends | source |
| Contact and support | Not published on the collected pages. | — |
| Legal and privacy | Not published on the collected pages. | — |
| Security and compliance | Not published on the collected pages. | — |
| Uptime and status page | Not published on the collected pages. | — |
| Domain registered | 2011-03-28 | — |
| Domain expires | 2029-02-26 | — |
Not found on the collected pages: contact and support, legal and privacy, security and compliance, uptime and status page. This only means Scout did not find it on the pages it read; it says nothing about the company itself.
Documentation and product updates
Help resources, product guidance, and visible changes over time.
| Resource or update | Type | What is available | Date or freshness |
|---|---|---|---|
| Altisource Portfolio Solutions (ASPS) Earnings Preview: Tracking the Housing Recovery | Release notes | Public product change history. (source) | Not dated |
| Why Is Element Solutions (ESI) Stock Down -8.70% Today? | Product update | Product update is publicly available. (source) | Not dated |
Not found in the collected public sources: public roadmap, status page, separate help center or knowledge base.
Technical
Technical and delivery signals
Delivery model, platforms, API, data ownership, reliability claims and release activity.
| Signal | Finding | Source |
|---|---|---|
| Delivery model (cloud, self-hosted, desktop, browser extension) | Tickeron is a web application accessed via browser S1. | S1 |
| Platforms and apps | Available on web platform S1. | S1 |
| API and extensibility (API, SDK, webhooks, MCP, plugins) | Not published on the collected pages. | — |
| Data ownership and export | Not published on the collected pages. | — |
| Performance and reliability claims | Not published on the collected pages. | — |
| Release activity | Not published on the collected pages. | — |
Measured infrastructure
Domain, certificate, and hosting signals, measured directly.
| Signal | Finding |
|---|---|
| Domain registered | 2011-03-28 — Amazon Registrar, Inc. |
| Domain expires | 2029-02-26 |
| First archived | 2004-03-22 — web archive |
| TLS certificate | Google Trust Services, valid, expires 2026-12-31 |
| Security headers | CSP, X-Content-Type-Options, X-Frame-Options, Referrer-Policy |
| Headers not served | HSTS |
| Server header | cloudflare |
| Mail handled by | aspmx.l.google.com, ALT1.aspmx.l.google.com |
| Nameservers | hayes.ns.cloudflare.com, novalee.ns.cloudflare.com |
Technical site audit
A bounded multi-page crawl with page-level issues and URLs.
Scout — Bounded technical crawl
- Pages crawled: 15 of 15 maximum
- Technical health: 97/100
- Critical issues: 0
- Warnings: 7
- Notices: 6
Issues
| Severity | Issue | Value | Affected URL |
|---|---|---|---|
| notice | Meta description length should be reviewed | 211 | https://tickeron.com/crypto/ |
| warning | Title length should be reviewed | 74 | https://tickeron.com/ticker/FLYE/ |
| notice | Meta description length should be reviewed | 299 | https://tickeron.com/ticker/ANGO/ |
| warning | Title length should be reviewed | 82 | https://tickeron.com/ticker/SDEV/ |
| notice | Meta description length should be reviewed | 314 | https://tickeron.com/ticker/SDEV/ |
| warning | Title length should be reviewed | 69 | https://tickeron.com/ticker/APUS/ |
| warning | Title length should be reviewed | 80 | https://tickeron.com/ticker/PCRX/ |
| warning | Title length should be reviewed | 85 | https://tickeron.com/ticker/VCIG/ |
| notice | Meta description length should be reviewed | 304 | https://tickeron.com/ticker/AXTI/ |
| warning | Title length should be reviewed | 112 | https://tickeron.com/ticker/AAOI/ |
| notice | Meta description length should be reviewed | 302 | https://tickeron.com/ticker/AAOI/ |
| warning | Title length should be reviewed | 67 | https://tickeron.com/ticker/ASTS/ |
| notice | Meta description length should be reviewed | 310 | https://tickeron.com/ticker/ASTS/ |
Crawled pages
| Status | Title | H1s | Words | Response | URL |
|---|---|---|---|---|---|
| 200 | AI Tools for Stock Forecasts & Price Predictions \ | Tickeron | 1 | 884 | 112 ms |
| 200 | Crypto AI Trading - Advanced AI Predictions for Crypto Trading | 1 | 757 | 131 ms | https://tickeron.com/crypto/ |
| 200 | The Best Stock Market Blog Posts for Stock... | 1 | 1570 | 663 ms | https://tickeron.com/blogs/ |
| 200 | FLYE's Stochastic Oscillator is remaining in oversold zone for 3 days | 1 | 1648 | 171 ms | https://tickeron.com/ticker/FLYE/ |
| 200 | PFAI's RSI Oscillator recovers from overbought zone | 1 | 1633 | 175 ms | https://tickeron.com/ticker/PFAI/ |
| 200 | Why AngioDynamics (ANGO) Stock Is Down -24.8% in the Last 30 Days | 1 | 2562 | 169 ms | https://tickeron.com/ticker/ANGO/ |
| 200 | Why Stablecoin Development Corporation (SDEV) Stock Is Up +15% in the Last 30 Days | 1 | 2806 | 275 ms | https://tickeron.com/ticker/SDEV/ |
| 200 | RGP's RSI Oscillator is sitting in oversold zone for 9 days | 1 | 1505 | 179 ms | https://tickeron.com/ticker/RGP/ |
| 200 | APUS's Stochastic Oscillator remains in oversold zone for 7 days | 1 | 1661 | 321 ms | https://tickeron.com/ticker/APUS/ |
| 200 | PCRX in upward trend: price rose above 50-day moving average on October 07, 2026 | 1 | 1716 | 215 ms | https://tickeron.com/ticker/PCRX/ |
| 200 | SBFM sees MACD Histogram just turned negative | 1 | 1416 | 225 ms | https://tickeron.com/ticker/SBFM/ |
| 200 | VCIG in -9.29% downward trend, falling for three consecutive days on October 21, 2026 | 1 | 1343 | 218 ms | https://tickeron.com/ticker/VCIG/ |
| 200 | Why AXT, Inc. (AXTI) Stock Is Down -18.5% in the Last 30 Days | 1 | 2550 | 171 ms | https://tickeron.com/ticker/AXTI/ |
| 200 | Applied Optoelectronics (AAOI) Stock Analysis: AI Data Center Momentum Meets Capacity Constraints and Volatility | 1 | 2429 | 124 ms | https://tickeron.com/ticker/AAOI/ |
| 200 | Why AST SpaceMobile (ASTS) Stock Is Down -27.5% in the Last 30 Days | 1 | 2569 | 193 ms | https://tickeron.com/ticker/ASTS/ |
This is a bounded Scout crawl. Core Web Vitals and Lighthouse scores are not claimed unless a dedicated performance audit is connected.
Search Console and Analytics
First-party search and behavioral data connection state.
Modeled acquisition channels
| Channel | Estimated share |
|---|---|
| direct | 21.6% |
| search | 63.7% |
| search organic | 59.2% |
| search paid | 4.5% |
| social | 4.3% |
| social organic | 4.2% |
| social paid | 0.1% |
| referrals | 4.5% |
| paid referrals | 0.8% |
| 3.1% | |
| gen ai | 2.0% |
| affiliate | 0.0% |
| other | 0.0% |
First-party connections
| Integration | Status | Data available after connection |
|---|---|---|
| Google Search Console | Not connected | Clicks, impressions, CTR, average position, queries, pages, countries, and devices |
| Google Analytics | Not connected | Organic sessions, engagement, landing pages, conversions, geography, and devices |
No first-party Search Console or Analytics numbers are shown until the site owner authorizes the corresponding Google account. Scout traffic model values above are modeled estimates, not private analytics totals.
Limits and method
Limitations and open questions
Known constraints and missing evidence from the collected pages.
The collected pages do not mention any competitors by name. Evidence gaps include lack of detailed pricing for most plans, no customer reviews with named individuals, and no information on company ownership, security certifications, or API availability. Open questions remain about the actual performance of AI robots and the accuracy of forecasts, as no verified outcomes are provided.
Sources, method, and limitations
Evidence inventory, collection method, provider use, and constraints.
This report is based on 14 collected pages from tickeron.com, including product overviews, pricing pages, and blog articles. The evidence catalog includes 180 entries, but many are from blog posts about specific stocks and do not directly describe Tickeron's product. The external proof search was performed but did not yield additional verified customer or review data. Limitations include incomplete pricing information and lack of first-party customer testimonials.
- Pricing Pagehttps://tickeron.com/Verified
- Documentationhttps://tickeron.com/app/patterns/overview/Verified
- Pricing Pagehttps://tickeron.com/blogs/primis-financial-frst-q3-2026-earnings-preview-recovery-trends-and-digital-core-plans-20871/Verified
- Official Websitehttps://tickeron.com/blogs/altisource-portfolio-solutions-asps-earnings-preview-tracking-the-housing-recovery-20879/Verified
- Official Websitehttps://tickeron.com/blogs/why-is-atlas-energy-solutions-aesi-stock-down-6-50-today-20589/Verified
- Official Websitehttps://tickeron.com/blogs/why-is-element-solutions-esi-stock-down-8-70-today-20548/Verified
- Official Websitehttps://tickeron.com/blogs/why-is-forgent-power-solutions-fps-stock-down-18-04-today-20486/Verified
- Official Websitehttps://tickeron.com/blogs/why-is-macom-technology-solutions-mtsi-stock-down-9-11-today-20516/Verified
- Official Websitehttps://tickeron.com/blogs/why-is-pdf-solutions-pdfs-stock-down-7-13-today-20520/Verified
- Official Websitehttps://tickeron.com/blogs/why-is-penguin-solutions-peng-stock-down-8-07-today-20605/Verified
- Official Websitehttps://tickeron.com/blogs/why-is-power-solutions-international-psix-stock-down-7-77-today-20625/Verified
- Official Websitehttps://tickeron.com/blogs/why-is-select-water-solutions-wttr-stock-down-8-04-today-20611/Verified
- Official Websitehttps://tickeron.com/blogs/why-is-viavi-solutions-viav-stock-down-9-78-today-20515/Verified
- Documentationhttps://tickeron.com/app-ng/screenerVerified