6.1k stars · MIT · v1.6.0 (2026-02-26) · Track this in Scout
Works out how much of each investment to hold, from past prices and a stated goal.
▶Repo detailsthe review · specs · pros & cons · install
What it does
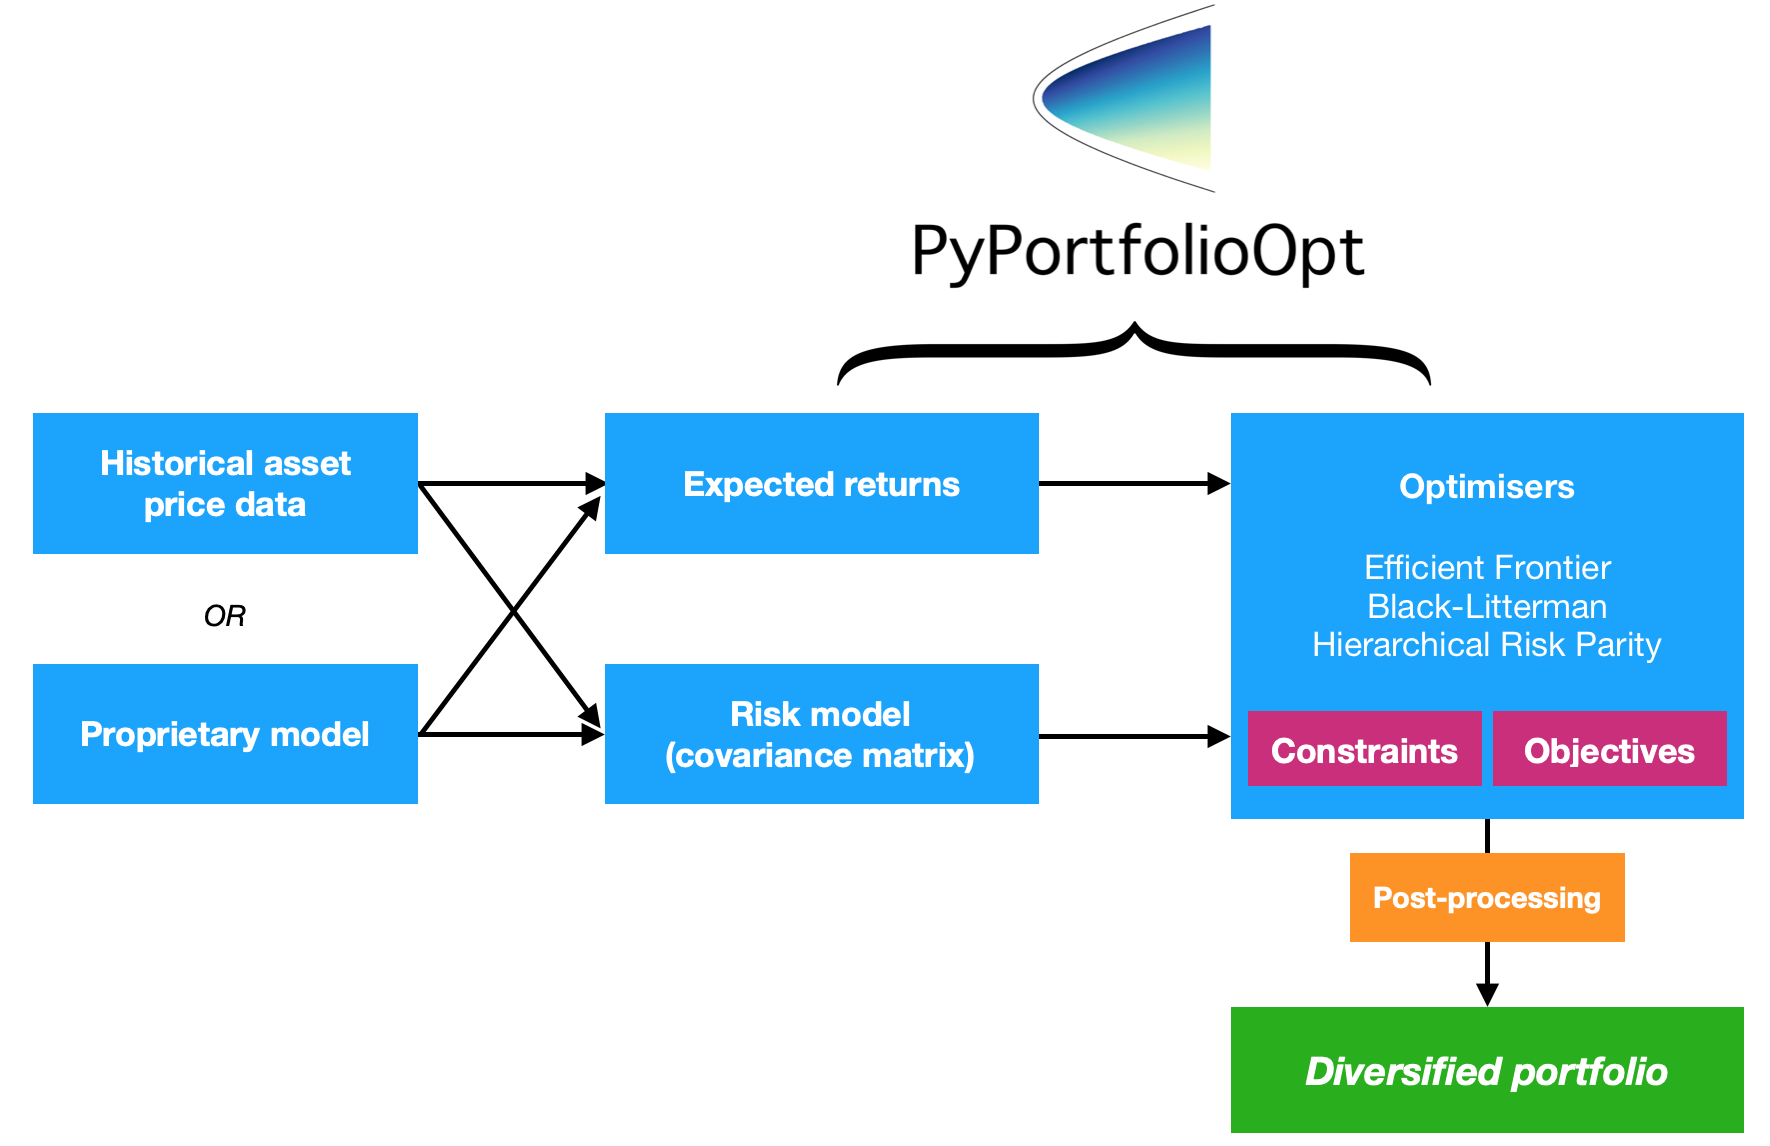
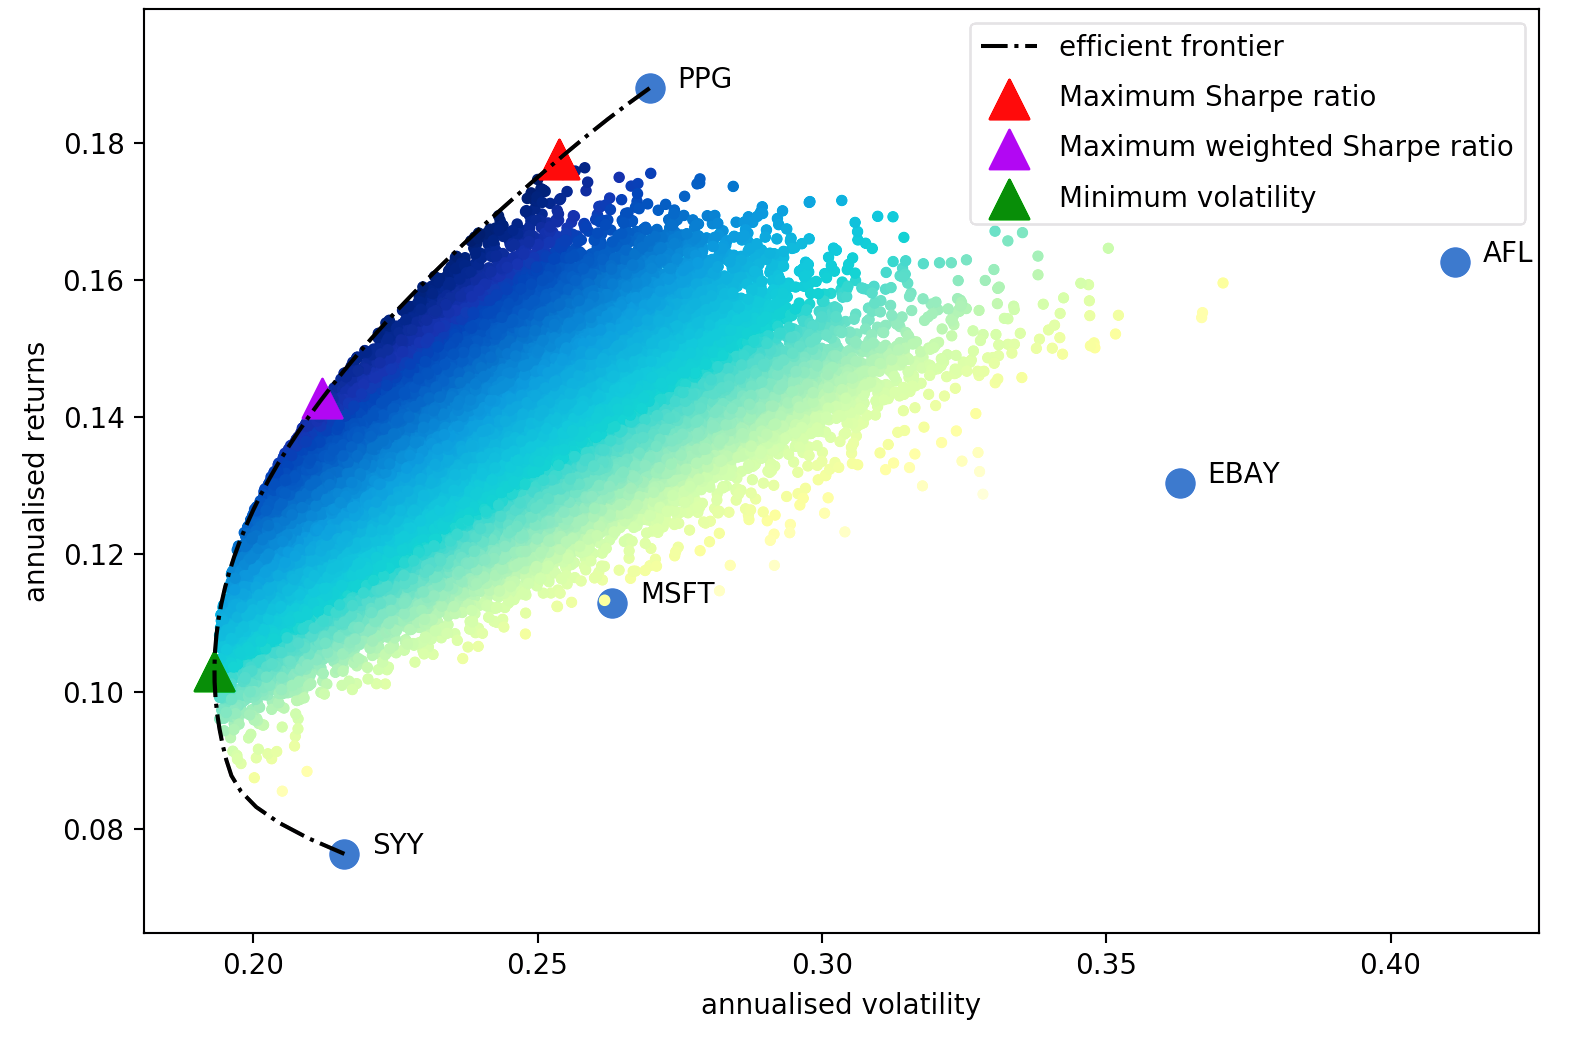
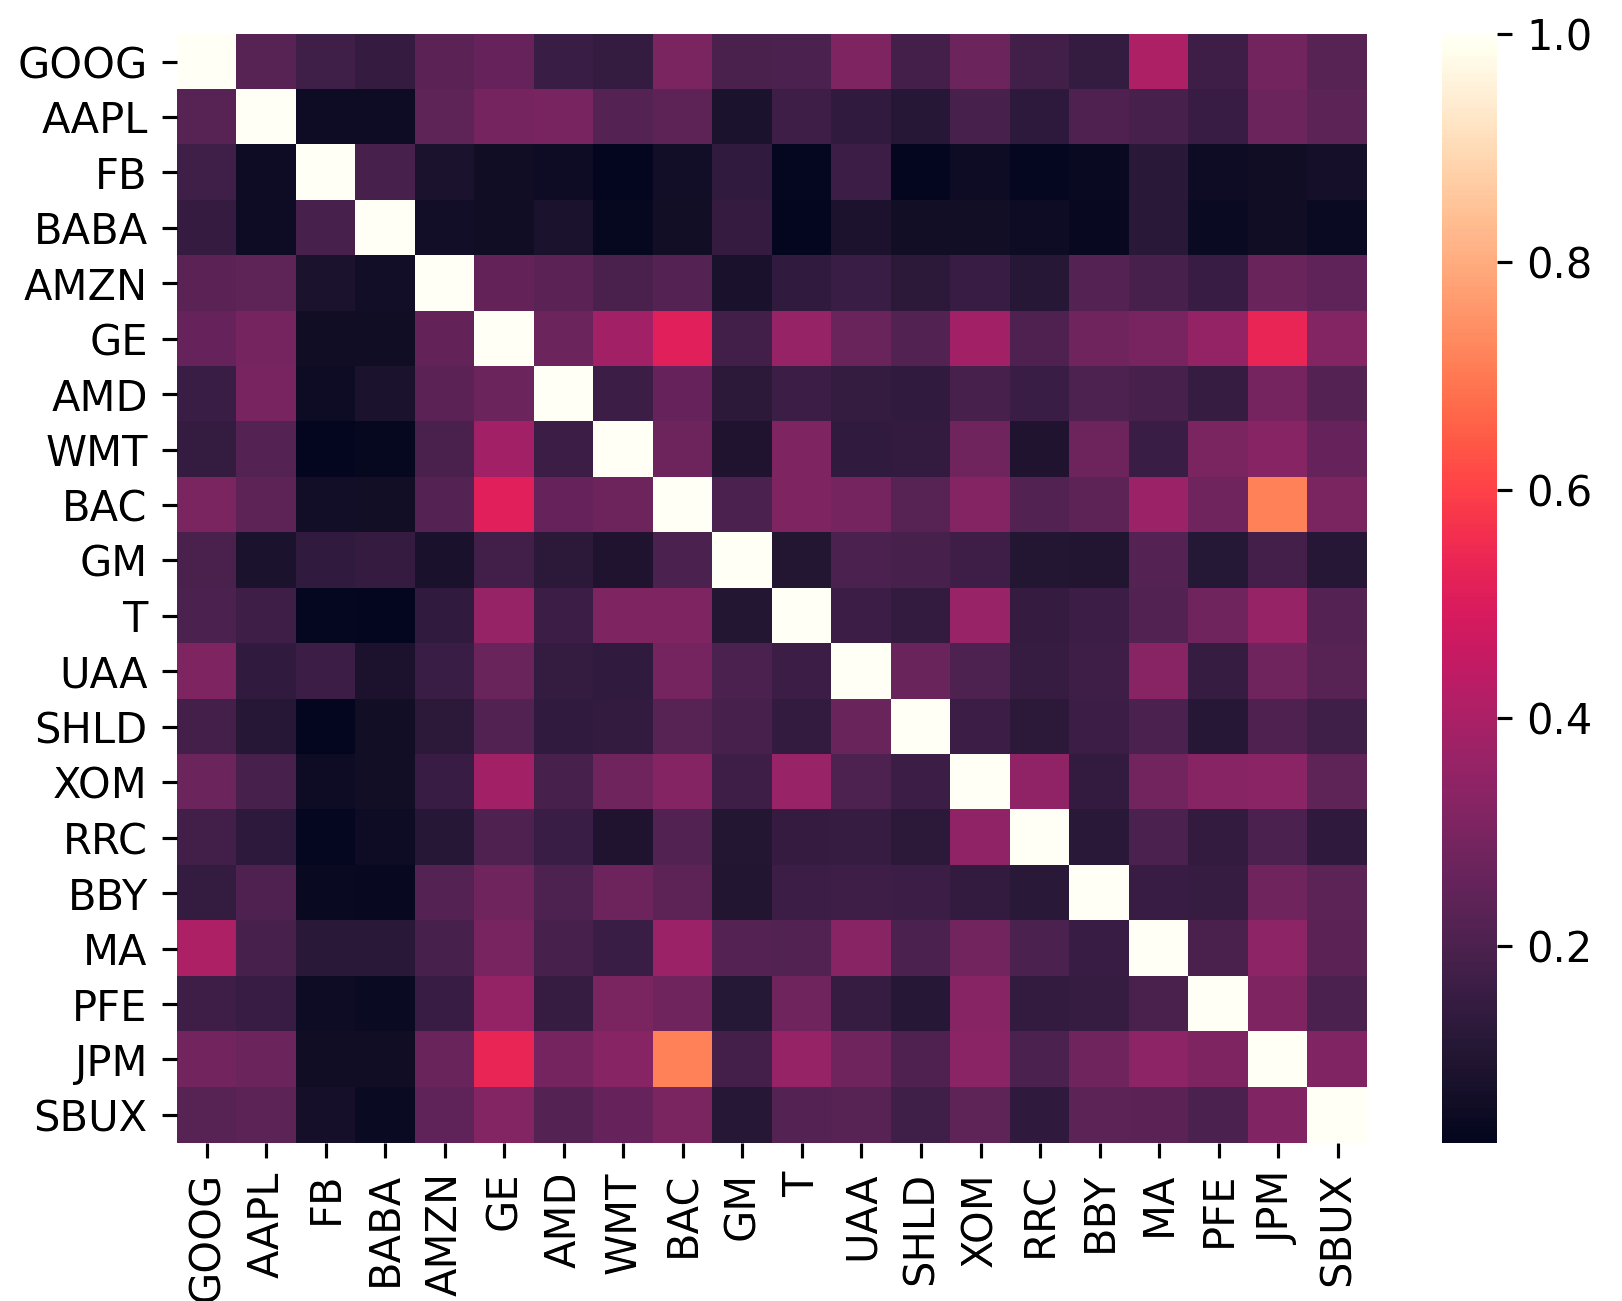
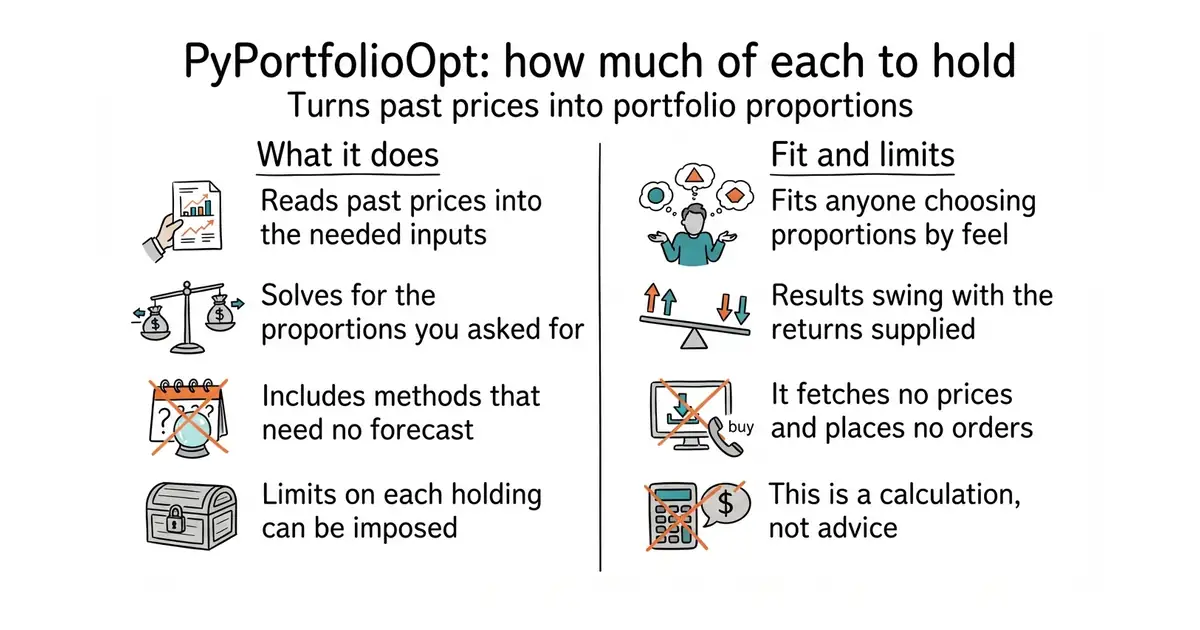
It takes a table of historical prices and turns it into the two inputs the mathematics needs: expected returns and a covariance matrix, which describes how the investments move together. It then solves for the proportions that best meet a goal you choose, such as the best return for a given risk or the lowest possible volatility. It includes the classical efficient frontier, the Black-Litterman model for folding your own views into the market's, and hierarchical risk parity, which groups similar investments before allocating. The covariance estimates can be shrunk, which makes them less sensitive to noise in the price history. Constraints are supported, so a maximum per holding or a sector limit can be imposed. Version 1.6.0 was published on 26 February 2026. It fetches no data and places no orders: prices come from somewhere else, and so does any decision to act.
Why it matters
Who it suits. Anyone who already holds a basket of investments and currently decides the proportions by feel. It suits a researcher who wants a standard, readable implementation rather than their own, because the documentation explains the mathematics as it goes. Skip it if the holding is a single index fund, because there is nothing here to optimise.
Verdict. Worth an hour for the education alone, with one large caveat that the project itself states plainly. These methods are extremely sensitive to the expected returns they are given, and expected returns estimated from past prices are not reliable. The honest way to use this is to start with the minimum-volatility and hierarchical risk parity options, which need no return forecast, and to treat anything built on forecast returns as an experiment. The library is clear about this in its own documentation, which is to its credit. It is also moving slowly: the published version is from February 2026 and code was pushed on 7 July 2026, both comfortably current but not a project shipping weekly. Nothing here is financial advice and this report is not a financial adviser; the output is a calculation, not a recommendation. For measuring how a portfolio actually did rather than deciding what to hold, ranaroussi/quantstats from Edition 4 is the companion.
- The documentation teaches the mathematics while showing the code, which is rare.
- Includes methods that need no return forecast, which are the ones worth trusting most.
- Constraints are first-class, so real limits on holdings can be expressed.
- Results swing wildly with the expected returns supplied, and those are hard to estimate.
- No data and no trading. Two other pieces are needed before anything happens.
- Development is slow, so a reported problem may sit for a while.
 ranaroussi/quantstats
Apache-2.0, covered in Edition 4; measures how a portfolio performed, with risk figures and an exportable report, where this one decides what to hold in the first place.
Track this in Scout cvxgrp/cvxportfolio
GPL-3.0, covered in Edition 39; builds and back-tests portfolio policies over time including transaction costs, which is heavier and closer to a simulation than a single allocation.
Track this in Scout
python3 -m venv venv
source venv/bin/activate
pip install PyPortfolioOpt