1.1k stars · Apache-2.0 · npm v4.32.0 (2026-06-25); no GitHub releases · Track this in Rising ↗
WebGL 2D/3D graph canvas for React with clustering — the zoomed-out constellation view that hands off to React Flow.
Radar check
What we found when we opened it. Every bar is one fact, with its date.
Last code pushed 25 Jun 2026, 4 months before this check.
No releases published on GitHub; the code date above is the one to trust.
Public since April 2022, a little over 4 years.
1,098 stars and 93 forks.
0 commits and 0 new issues in the last 90 days.
41 contributors. No pull requests merged in 90 days; changes go in directly.
No security policy file says how to report a problem. No published security advisories.
How the bars are scored
- Alive. Days since the last code push: a week or less 100, a month 90, three months 70, six months 50, a year 30, eighteen months 15, older 0.
- Releases. Age of the latest GitHub release, on a similar scale; no bar when the project publishes no releases.
- Maturity. Age of the project: eight years 100, five 90, three 70, two 55, one 40, six months 25, younger 10.
- Adoption. Stars on a log scale: 100,000 stars is 100, 10,000 is 80, 1,000 is 60, 100 is 40.
- Activity. Commits in the last 90 days: 300 or more 100, 100 85, 30 65, 10 45, any 25.
- Community. People who have contributed: 100 or more 100, 30 80, 10 60, 5 40, 2 25, one 10.
- Security. A published security policy 80, none 40; published advisories are listed, not scored.
Checked by Repo Radar on 27 Oct 2026 from the repository on GitHub. Covered in Edition 3.
▶Repo detailsthe review · specs · pros & cons · install
What it does
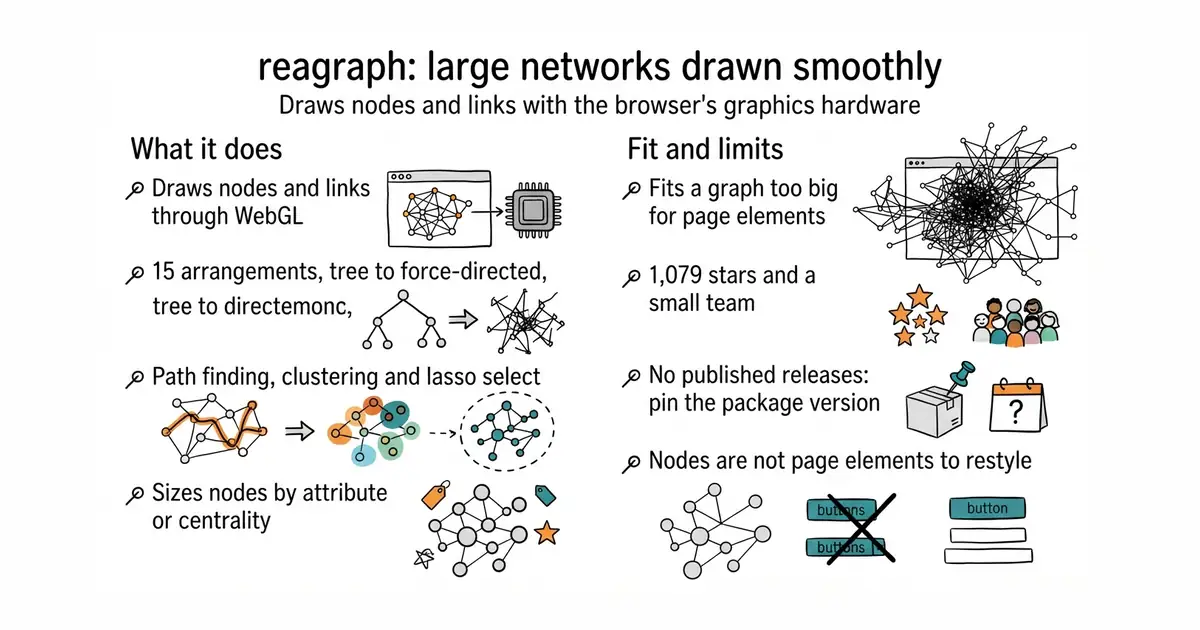
You give a GraphCanvas component a list of nodes and a list of edges and it draws them. The drawing goes through WebGL, the browser's route to the graphics hardware, which is why the node count can be high. The README lists 15 features and 15 arrangements. The features include sizing nodes by an attribute or by how central they are, light and dark themes, path finding between two nodes, a ring-shaped menu on a node, dragging, lasso selection, expanding and collapsing, edge bundling and badges on nodes. The arrangements include force-directed in two and three dimensions, circular, tree in two directions, radial, hierarchical, no-overlap and concentric. It is Apache-2.0, has 1,154 commits, and carries a CLAUDE.md in its root, which means a coding assistant working on it has guidance written by the maintainers. What it does not do is state any limits in its README, and it has no published GitHub release at all, so the version comes from the package registry.
Why it matters
Who it suits. Anyone drawing a network that got too big for ordinary web elements. The usual sign is a canvas that was fine in testing and stutters on real data somewhere past one or two thousand visible nodes. This is the answer to that specific ceiling, and the sensible shape is to use it for the wide view, let someone pick a cluster, and hand the readable close-up to something else. Skip it if your graph has fifty nodes, because a simpler library will give you more control over how each one looks.
Verdict. Worth a day if the ceiling is real, and it is the kind of small project that solves one hard problem well. Three risks, stated plainly. At 1,079 stars with 10 open issues and one maintaining organisation, this is a small dependency to put at the centre of an interface. There are no GitHub releases, so the only version marker is 4.32.0 at the package registry and the changelog file in the repository, which means pinning the version and reading that file is not optional. And because nodes are drawn by the graphics hardware rather than built as page elements, existing designs cannot be reused inside them, which is a real cost if you have a card design you like. Code landed on 25 June 2026, three and a half months before this rewrite. The close alternative is xyflow/xyflow, which is the right choice for the readable view and which Edition 1 covered.
Summary (Key Points)from the README
Key features
- WebGL rendering: Built on WebGL for high-performance network graph visualization in React.
- Node sizing: Sizes nodes by attribute, page rank, centrality, or a custom function.
- Themes: Supports light and dark mode, with the option of a custom theme.
- Path finding: Finds paths between nodes.
- Interaction: Includes a radial context menu, a highlight and selection hook, node dragging, and lasso selection.
- Expand and collapse: Lets users expand and collapse nodes.
- Labels and edges: Offers advanced label placement, edge interpolation and styling, and edge bundling.
- Clustering and badges: Provides node clustering and node badges, with customizable nodes.
- Built-in layouts: Ships 15 layouts, including force directed (2D and 3D), circular, tree, radial out, hierarchical, No Overlap, Force Atlas2, and concentric.
Important
- Runtime requirement: The README describes it as a React component library, so it needs a React project to use.
- Setup: Usage is an NPM or Yarn install followed by importing the component and supplying nodes and edges; the README points to a CodeSandbox example rather than a full guide.
- Documentation location: Detailed docs and demos live on an external site, not in the README.
- Local development: Running from source uses npm i and npm start, which opens a Storybook page in the browser.
Written by an AI model from the project’s README; not part of the review, and it can be wrong.
- The graphics hardware draws node counts that make page-element canvases stutter.
- 15 arrangements and clustering built in, so no hand-written layout mathematics.
- Apache-2.0, and the repository carries maintainer-written guidance for a coding assistant.
- 1,079 stars and a small team, which is a real risk for something load-bearing in an interface.
- No GitHub releases at all: the version lives at the package registry and the changelog file.
- Nodes are not page elements, so existing component designs cannot be reused inside the drawing.
npm i reagraph --save